

Question
The data from the European Social Survey (ESS) has variables that include time spent reading newspapers (in minutes) on an average weekday and years invested
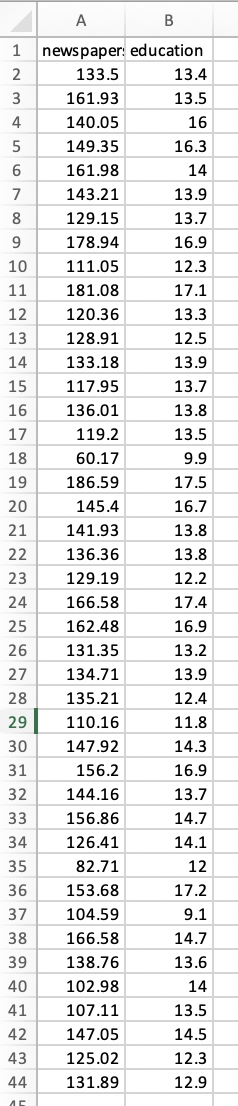
The data from the European Social Survey (ESS) has variables that include time spent reading newspapers (in minutes) on an average weekday and years invested in obtaining the highest level of education (years). A random sample of observations (n= 43) is obtained and stored in an Excel file YoE_NewspaperReading.xlsx for people from Slovenia. The file contains two variables: education (in years) and newspaper (reading time in minutes on an average weekday).
A researcher investigates the relationship between years of education and time spent reading newspapers on an average weekday. Specifically, he wants to answer the following research question:
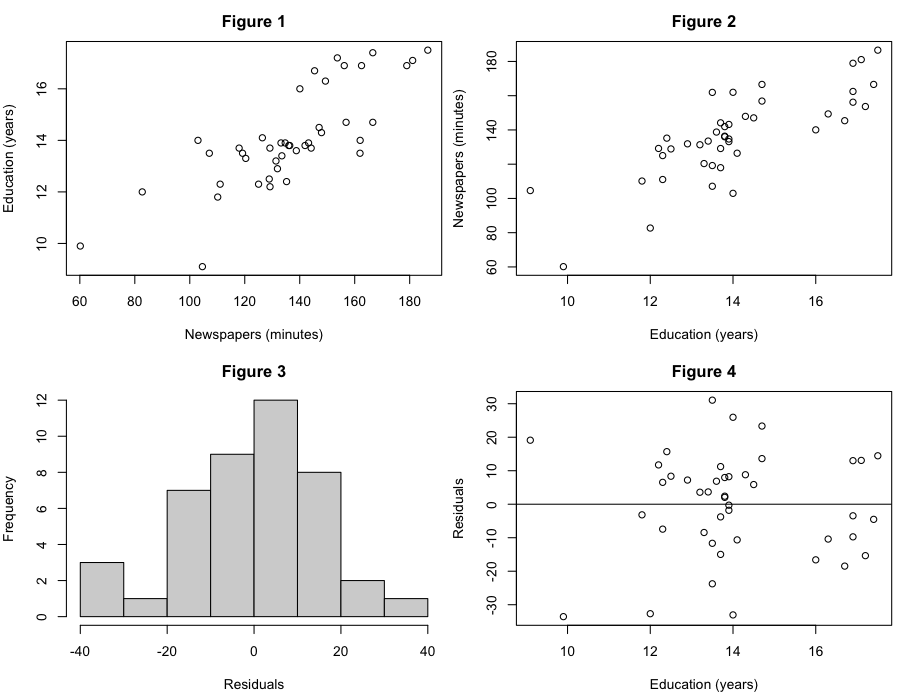
Research Question: "Is there a linear relationship between time spent reading newspapers on an average day (variable: newspaper) and years of education (variable: education)?"
To help you check the relevant assumptions of the simple linear regression, four graphs are provided below:
Step by Step Solution
There are 3 Steps involved in it
Step: 1

Get Instant Access to Expert-Tailored Solutions
See step-by-step solutions with expert insights and AI powered tools for academic success
Step: 2

Step: 3
Ace Your Homework with AI
Get the answers you need in no time with our AI-driven, step-by-step assistance
Get Started
WebAssign For A First Course In Differential Equations With Modeling Applications
Authors: Dennis G Zill
11th Edition
1337879770, 9781337879774