Question
The data in the following table present revenues and expenditures by categorized type for the School of Public Affairs at Enormous State University. As with
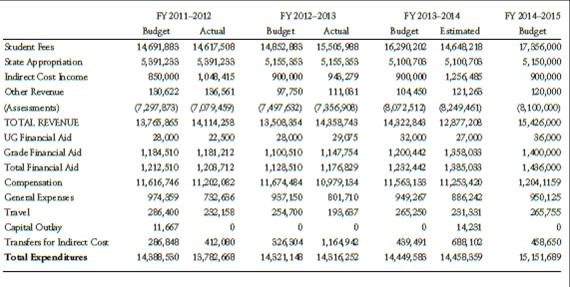
The data in the following table present revenues and expenditures by categorized type for the School of Public Affairs at Enormous State University. As with most elite programs at state universities, the school has accepted missions of teaching, research, and service to the university, state, and nation. The data include budgeted and actual data for three years and the proposed budget for fiscal 2014–2015. Your task as a budget analyst is to learn as much as possible about the operations of the school and its plans for the budget year just from these data. In particular, you should look for trends, changes in shares and ratios, and the categories that are particularly important in driving the finances of the school. A few notes about the reported data: First, the state appropriates money to the university and then the central administration distributes that money to the various operations on campus. That is the source of the state appropriation number—it has been assigned to the school, so this number for 2014–2015 is an actual. All others are part of the request. Second, the central administration charges the school for the services that it provides (central library, computer networks, etc.). This charge is the assessment number in the table. It is based on school operations during the year, so it is an estimate and counts as a negative component in school revenue. Your answer to this exercise should include both your conclusions from your analysis and a list of questions that your analysis has led you to have for the person who prepared the 2014–2015 budget. Suppose the central administration has asked for each school to reduce its spending by 5 percent. Where would you suggest that the school turn to make that reduction?

Student Fees State Appropriation Indirect Cost Income Other Revenue (Assessments) TOTAL REVENUE UG Financial Aid Grade Financial Aid Total Financial Aid Compensation General Expenses Travel Capital Outlay Transfers for Indirect Cost Total Expenditures FY 2011-2012 Budget Actual 14691,883 14617,508 5,391,233 5,391,233 850,000 1,048,415 130,622 136,561 (7,297,873) 7079,459) 13,765,865 14,114,258 28,000 22,500 1,184,510 1,181,212 1,212,510 1,208,712 11,616,746 11,202,062 974,359 732,686 286,400 232,158 11,667 0 286,848 412,000 14,388,550 13,782,668 FY 2012-2013 Budget Actual 14,852,883 15,505,988 5,155,953 5,155,359 900,000 946,279 97,750 111,061 FY 2013-2014 Budget Estimated 16,290,202 14,648,218 5,100,706 5,100,706 900,000 1,256,485 104 450 121,266 A97 (532) (8,072,512) 8,249461) 7356,908) 13,508,354 14,358,743 28,000 29,075 14,322,843 12,877,208 32,000 27,000 1,100,510 1,147,754 1,200,442 1,358,033 1,128,510 1,176,829 1,232,442 1,385,038 11,674,484 10,979,134 11,563,138 11,253,420 937,150 801,710 254,700 193,637 949,267 886,242 265,250 231,331 0 0 0 14,231 1,16494 439,491 688, 102 326,304 14,321,148 14,316252 14,449,586 14,458,359 FY 2014-2015 Budget 17,356,000 5,150,000 900,000 120,000 (8,100,000) 15,426,000 36,000 1,400,000 1,436,000 1,204,1159 950,125 265,755 0 458,650 15,151,689
Step by Step Solution
3.49 Rating (152 Votes )
There are 3 Steps involved in it
Step: 1
Given the budget data provided one possible solution to reducing ...
Get Instant Access to Expert-Tailored Solutions
See step-by-step solutions with expert insights and AI powered tools for academic success
Step: 2

Step: 3

Ace Your Homework with AI
Get the answers you need in no time with our AI-driven, step-by-step assistance
Get Started


