

Question
The data in the table below, represent individual observations on molecular weight taken hourly from a chemical process. The target value of molecular weight is
The data in the table below, represent individual observations on molecular weight taken hourly from a chemical process. The target value of molecular weight is 1050 and the process standard deviation is thought to be about s = 25. 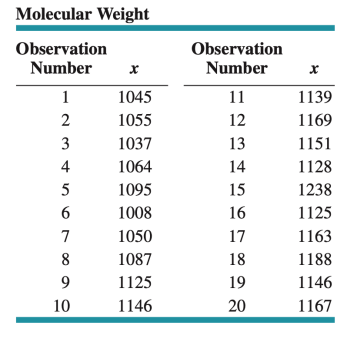
Molecular Weight a. Set up an EWMA control chart with I=0.1 and L=2.7. Interpret the results. b. Setup moving average control chart with w=6. Compare the results obtained with (a.)
Step by Step Solution
There are 3 Steps involved in it
Step: 1

Get Instant Access to Expert-Tailored Solutions
See step-by-step solutions with expert insights and AI powered tools for academic success
Step: 2

Step: 3
Ace Your Homework with AI
Get the answers you need in no time with our AI-driven, step-by-step assistance
Get Started
Principles and Modern Applications of Mass Transfer Operations
Authors: Jaime Benitez
2nd edition
470181788, 470181782, 978-1-119-0427, 978-0470181782