Question
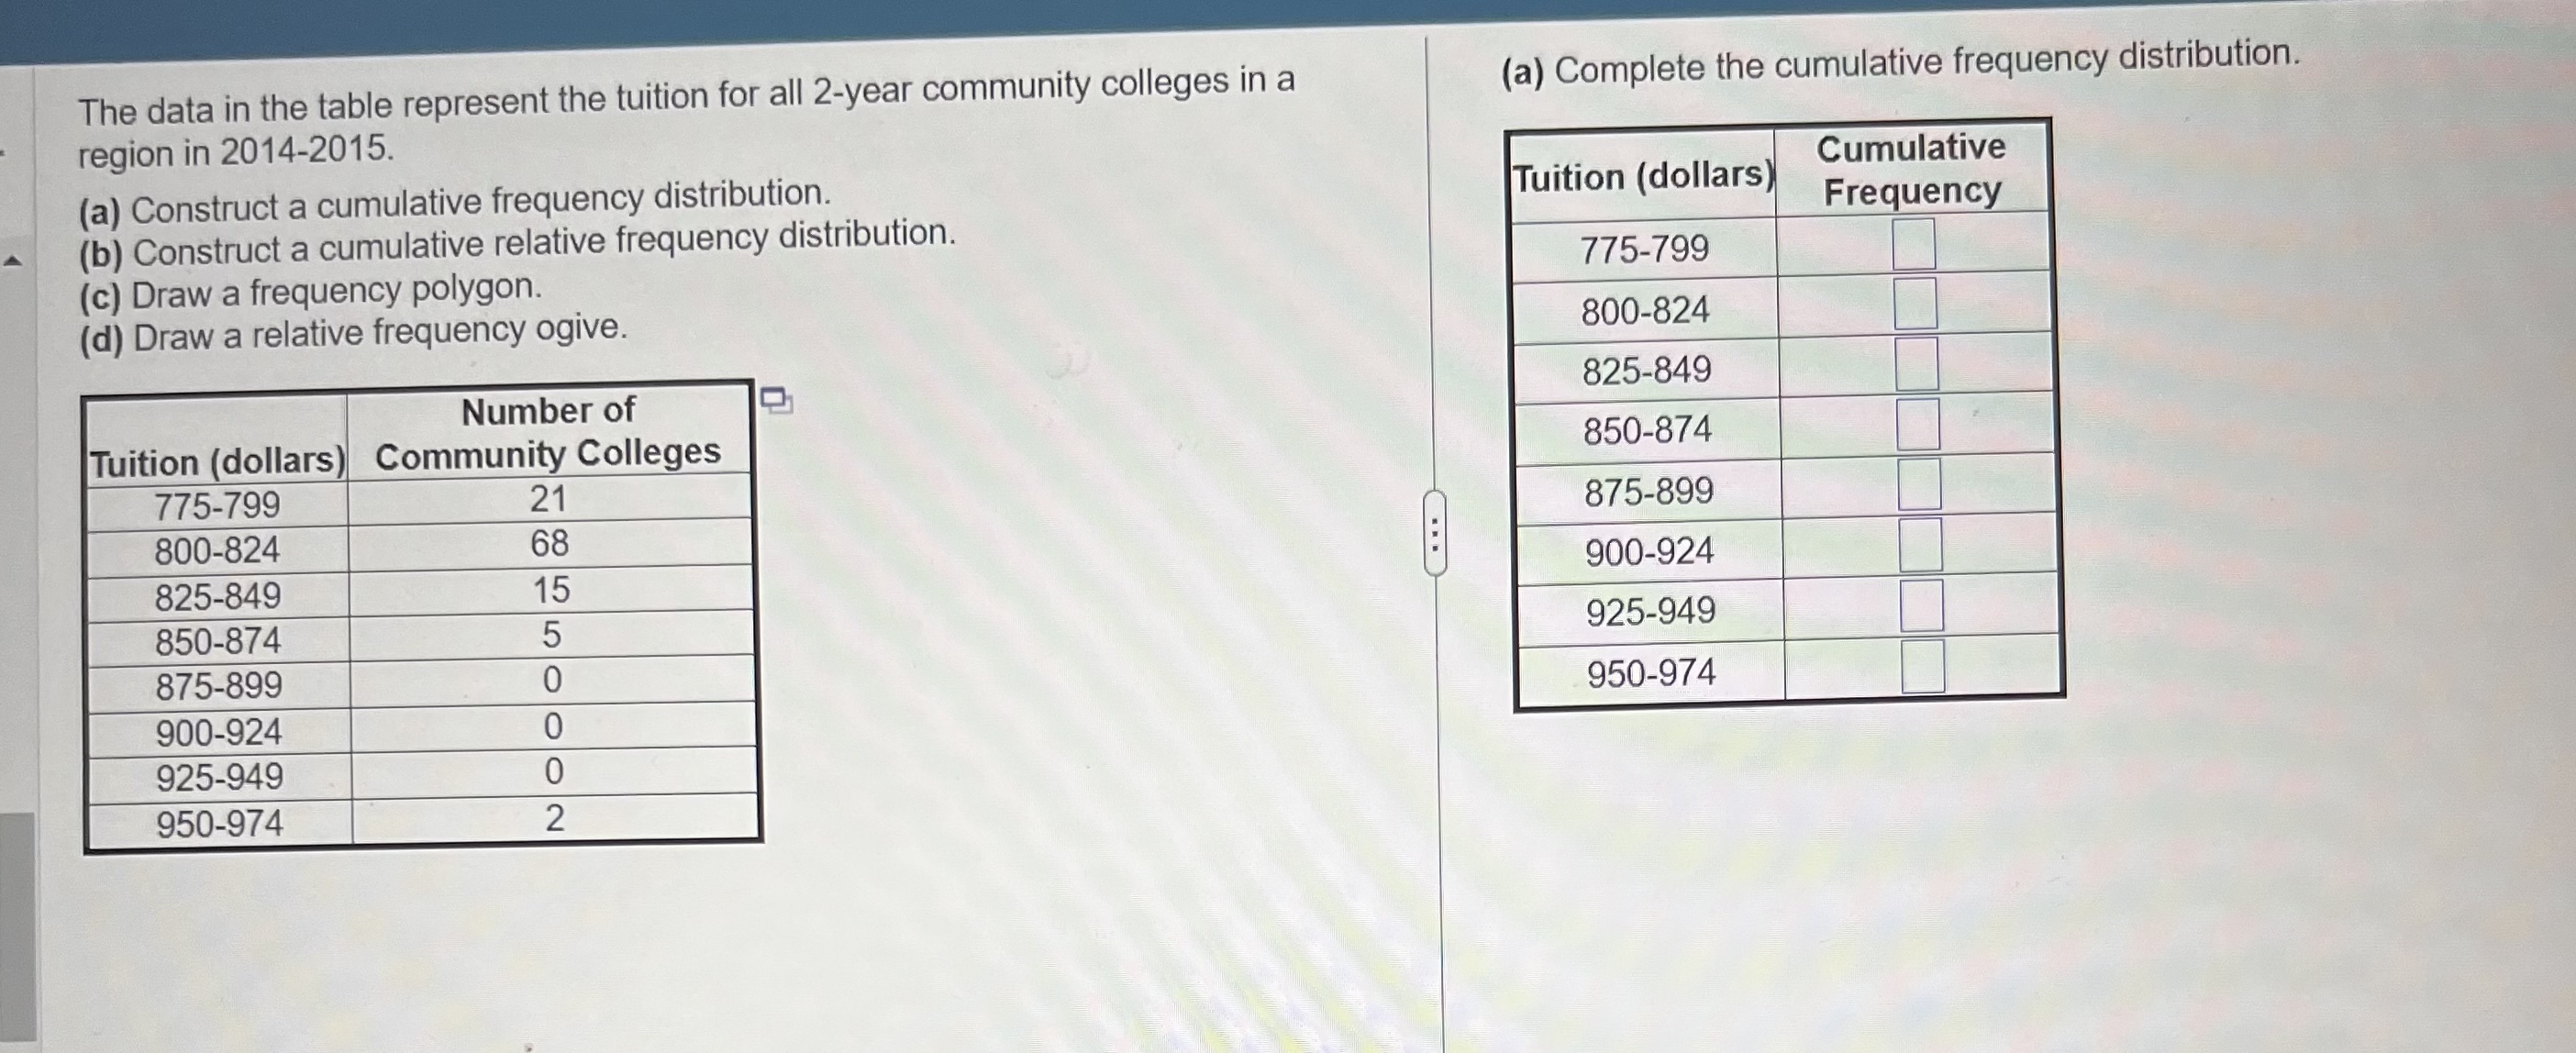
The data in the table represent the tuition for all 2-year community colleges in a region in 2014-2015. (a) Construct a cumulative frequency distribution.

The data in the table represent the tuition for all 2-year community colleges in a region in 2014-2015. (a) Construct a cumulative frequency distribution. (b) Construct a cumulative relative frequency distribution. (c) Draw a frequency polygon. (d) Draw a relative frequency ogive. Number of Tuition (dollars) Community Colleges 775-799 800-824 825-849 850-874 875-899 900-924 925-949 950-974 21 68 15 5 0 0 0 2 (a) Complete the cumulative frequency distribution. Cumulative Frequency Tuition (dollars) 775-799 800-824 825-849 850-874 875-899 900-924 925-949 950-974
Step by Step Solution
There are 3 Steps involved in it
Step: 1

Get Instant Access to Expert-Tailored Solutions
See step-by-step solutions with expert insights and AI powered tools for academic success
Step: 2

Step: 3

Ace Your Homework with AI
Get the answers you need in no time with our AI-driven, step-by-step assistance
Get StartedRecommended Textbook for
Elementary Statistics
Authors: Neil A. Weiss
8th Edition
321691237, 978-0321691231
Students also viewed these Mathematics questions
Question
Answered: 1 week ago
Question
Answered: 1 week ago
Question
Answered: 1 week ago
Question
Answered: 1 week ago
Question
Answered: 1 week ago
Question
Answered: 1 week ago
Question
Answered: 1 week ago
Question
Answered: 1 week ago
Question
Answered: 1 week ago
Question
Answered: 1 week ago
Question
Answered: 1 week ago
Question
Answered: 1 week ago
Question
Answered: 1 week ago
Question
Answered: 1 week ago
Question
Answered: 1 week ago
Question
Answered: 1 week ago
Question
Answered: 1 week ago
Question
Answered: 1 week ago
Question
Answered: 1 week ago
Question
Answered: 1 week ago
Question
Answered: 1 week ago
Question
Answered: 1 week ago
Question
Answered: 1 week ago
Question
Answered: 1 week ago
View Answer in SolutionInn App


