

Answered step by step
Verified Expert Solution
Question
1 Approved Answer
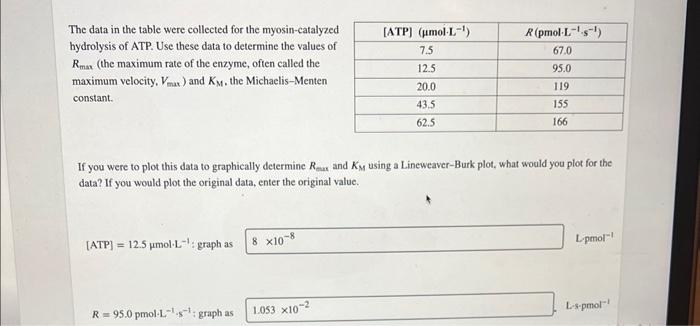
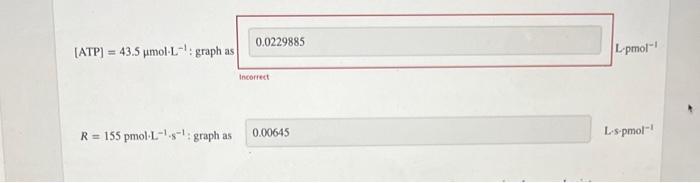
The data in the table were collected for the myosin-catalyzed hydrolysis of ATP. Use these data to determine the values of Rmax (the maximum rate
Step by Step Solution
There are 3 Steps involved in it
Step: 1

Get Instant Access to Expert-Tailored Solutions
See step-by-step solutions with expert insights and AI powered tools for academic success
Step: 2

Step: 3
Ace Your Homework with AI
Get the answers you need in no time with our AI-driven, step-by-step assistance
Get Started
Biochemistry
Authors: Mary K. Campbell, Shawn O. Farrell
8th edition
9781305176621, 1285429109, 1305176626, 978-1285429106