Answered step by step
Verified Expert Solution
Question
1 Approved Answer
The Data is about a direct marketer of electronic equipment and wants to investigate the efficacy in their company named HyTex. HyTex sent catalogues

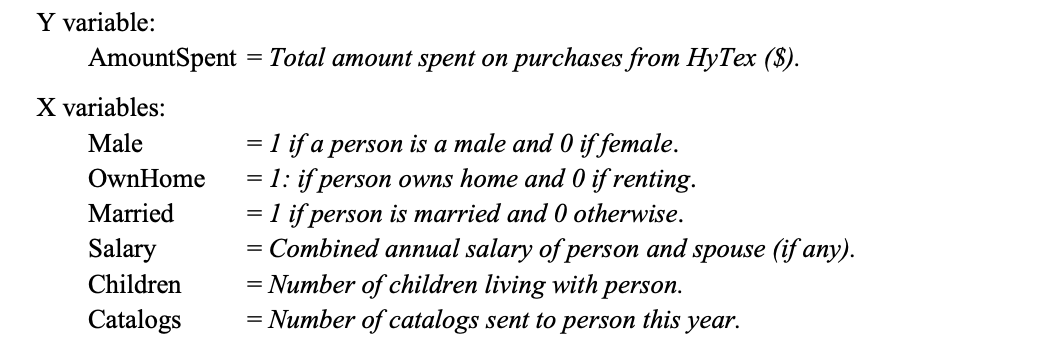
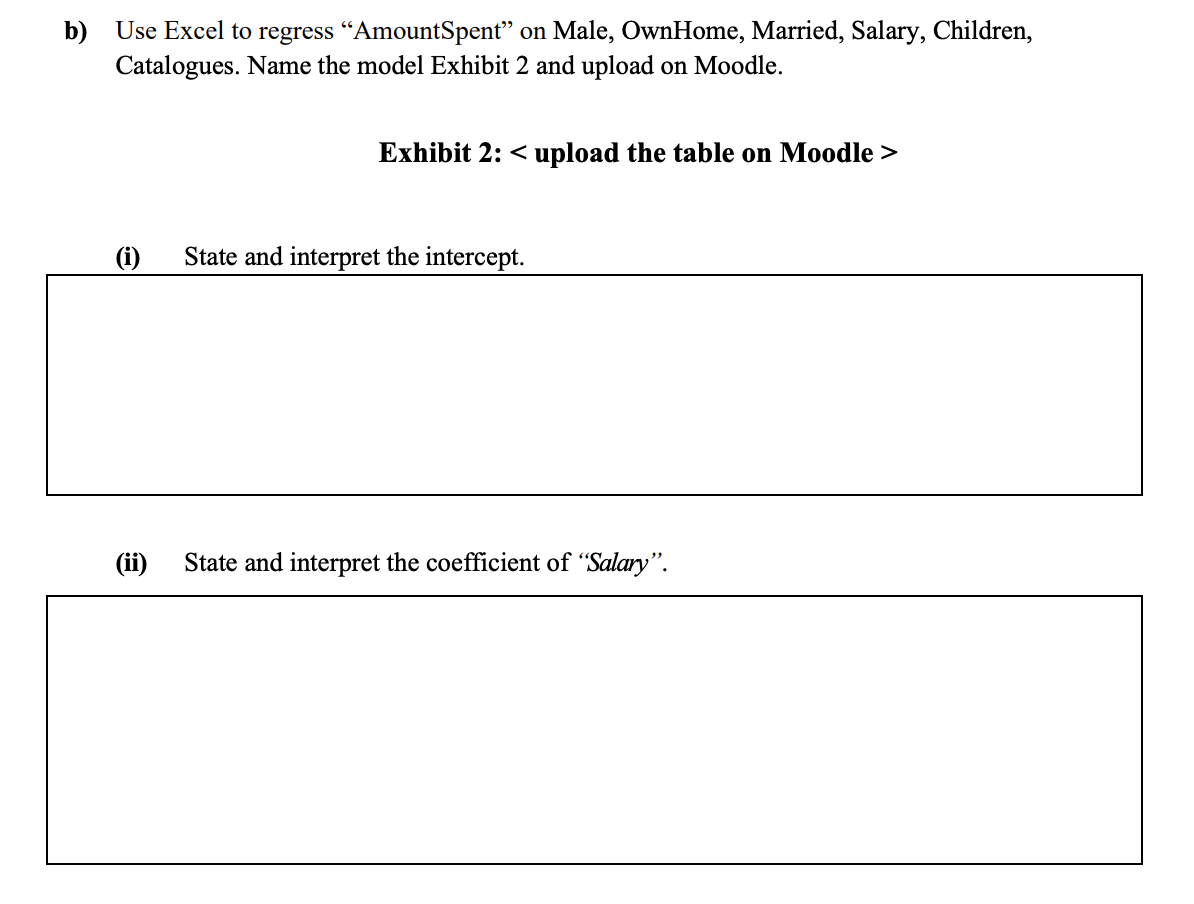

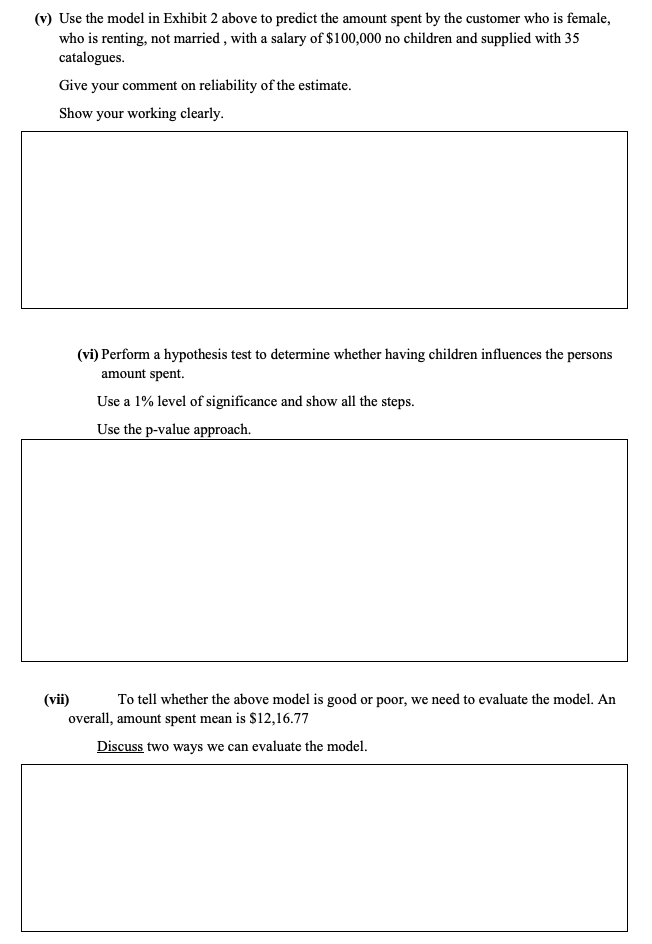
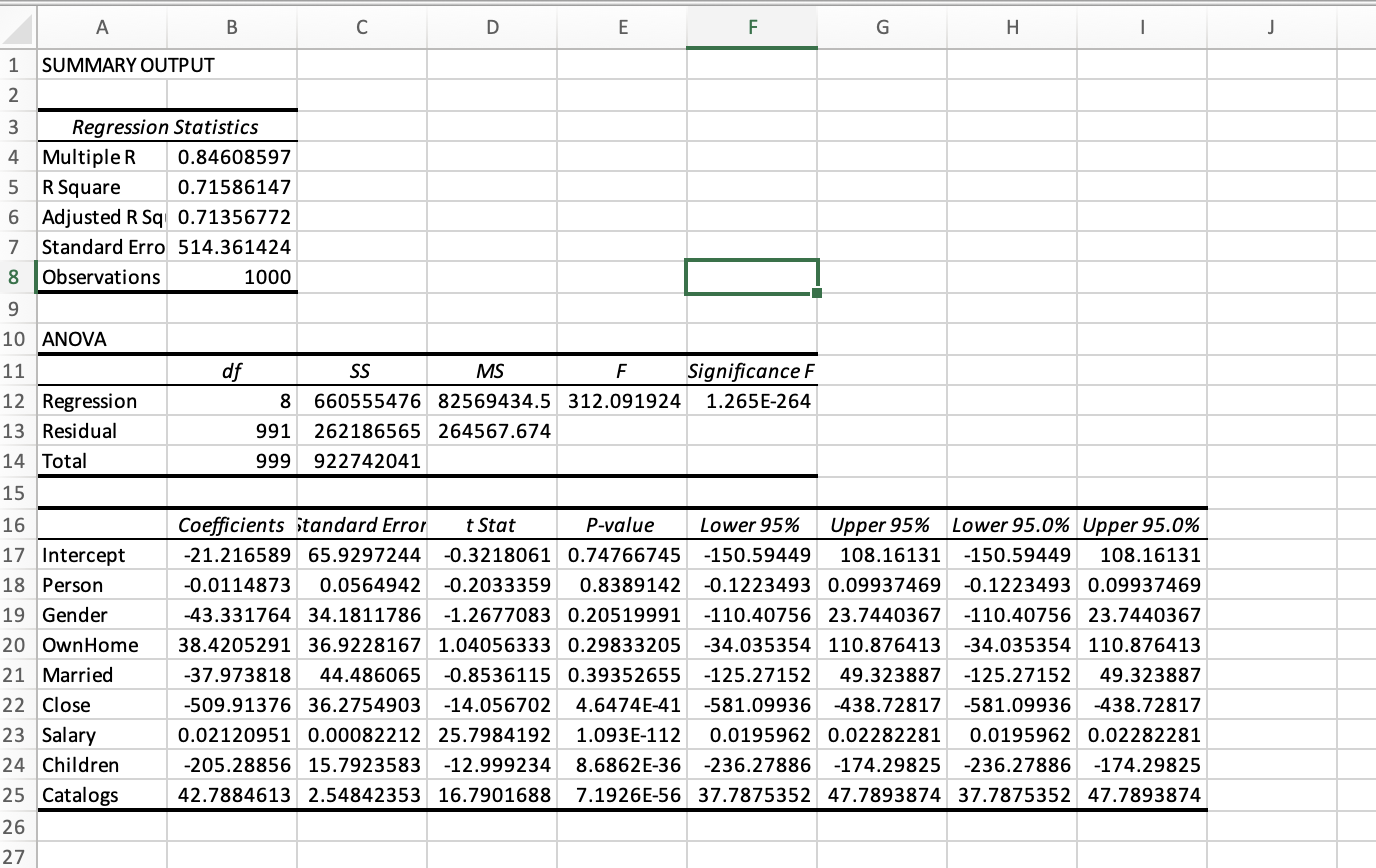
The Data is about a direct marketer of electronic equipment and wants to investigate the efficacy in their company named HyTex. HyTex sent catalogues to the customers and the question might be that, if it is sending the catalogues to the right customers and if not, to whom should it send the catalogues to. The file "Catalogue Marketing.xlsx" contains customer demographic attributes including the Marital Status of the customer and the Region they live in. Y variable: Amount Spent = Total amount spent on purchases from HyTex ($). X variables: Male OwnHome Married Salary Children Catalogs = 1 if a person is a male and 0 if female. = = 1: if person owns home and 0 if renting. 1 if person is married and 0 otherwise. = Combined annual salary of person and spouse (if any). = Number of children living with person. = Number of catalogs sent to person this year. b) Use Excel to regress Amount Spent" on Male, OwnHome, Married, Salary, Children, Catalogues. Name the model Exhibit 2 and upload on Moodle. Exhibit 2: < upload the table on Moodle > (i) State and interpret the intercept. (ii) State and interpret the coefficient of "Salary". (iii) State and interpret the coefficient of "Catalogs". (iv) State and interpret the coefficient of "Married". (v) Use the model in Exhibit 2 above to predict the amount spent by the customer who is female, who is renting, not married, with a salary of $100,000 no children and supplied with 35 catalogues. Give your comment on reliability of the estimate. Show your working clearly. (vii) (vi) Perform a hypothesis test to determine whether having children influences the persons amount spent. Use a 1% level of significance and show all the steps. Use the p-value approach. To tell whether the above model is good or poor, we need to evaluate the model. An overall, amount spent mean is $12,16.77 Discuss two ways we can evaluate the model. A B C D E F G H | J 1 SUMMARY OUTPUT 12 3 Regression Statistics 4 Multiple R 5 R Square 0.84608597 0.71586147 6 Adjusted R Sq 0.71356772 7 Standard Erro 514.361424 8 Observations 9 10 ANOVA 11 12 Regression df 1000 SS MS F Significance F 1.265E-264 8 660555476 82569434.5 312.091924 991 262186565 264567.674 999 922742041 13 Residual 14 Total 15 16 Coefficients standard Error 17 Intercept 18 Person 19 Gender 20 OwnHome 21 Married 22 Close 23 Salary 24 Children 25 Catalogs 26 27 Upper 95% Lower 95.0% Upper 95.0% -150.59449 108.16131 Lower 95% -150.59449 108.16131 -0.1223493 0.09937469 -0.1223493 0.09937469 t Stat P-value -21.216589 65.9297244 -0.3218061 0.74766745 -0.0114873 0.0564942 -0.2033359 0.8389142 -43.331764 34.1811786 -1.2677083 0.20519991 -110.40756 23.7440367 -110.40756 23.7440367 38.4205291 36.9228167 1.04056333 0.29833205 -34.035354 110.876413 -34.035354 110.876413 -37.973818 44.486065 -0.8536115 0.39352655 -125.27152 49.323887 -125.27152 49.323887 -509.91376 36.2754903 -14.056702 4.6474E-41 -581.09936 -438.72817 -581.09936 -438.72817 0.02120951 0.00082212 25.7984192 1.093E-112 0.0195962 0.02282281 0.0195962 0.02282281 -205.28856 15.7923583 -12.999234 -174.29825-236.27886 -174.29825 42.7884613 2.54842353 16.7901688 7.1926E-56 37.7875352 47.7893874 37.7875352 47.7893874 8.6862E-36-236.27886
Step by Step Solution
There are 3 Steps involved in it
Step: 1

Get Instant Access to Expert-Tailored Solutions
See step-by-step solutions with expert insights and AI powered tools for academic success
Step: 2

Step: 3

Ace Your Homework with AI
Get the answers you need in no time with our AI-driven, step-by-step assistance
Get Started


