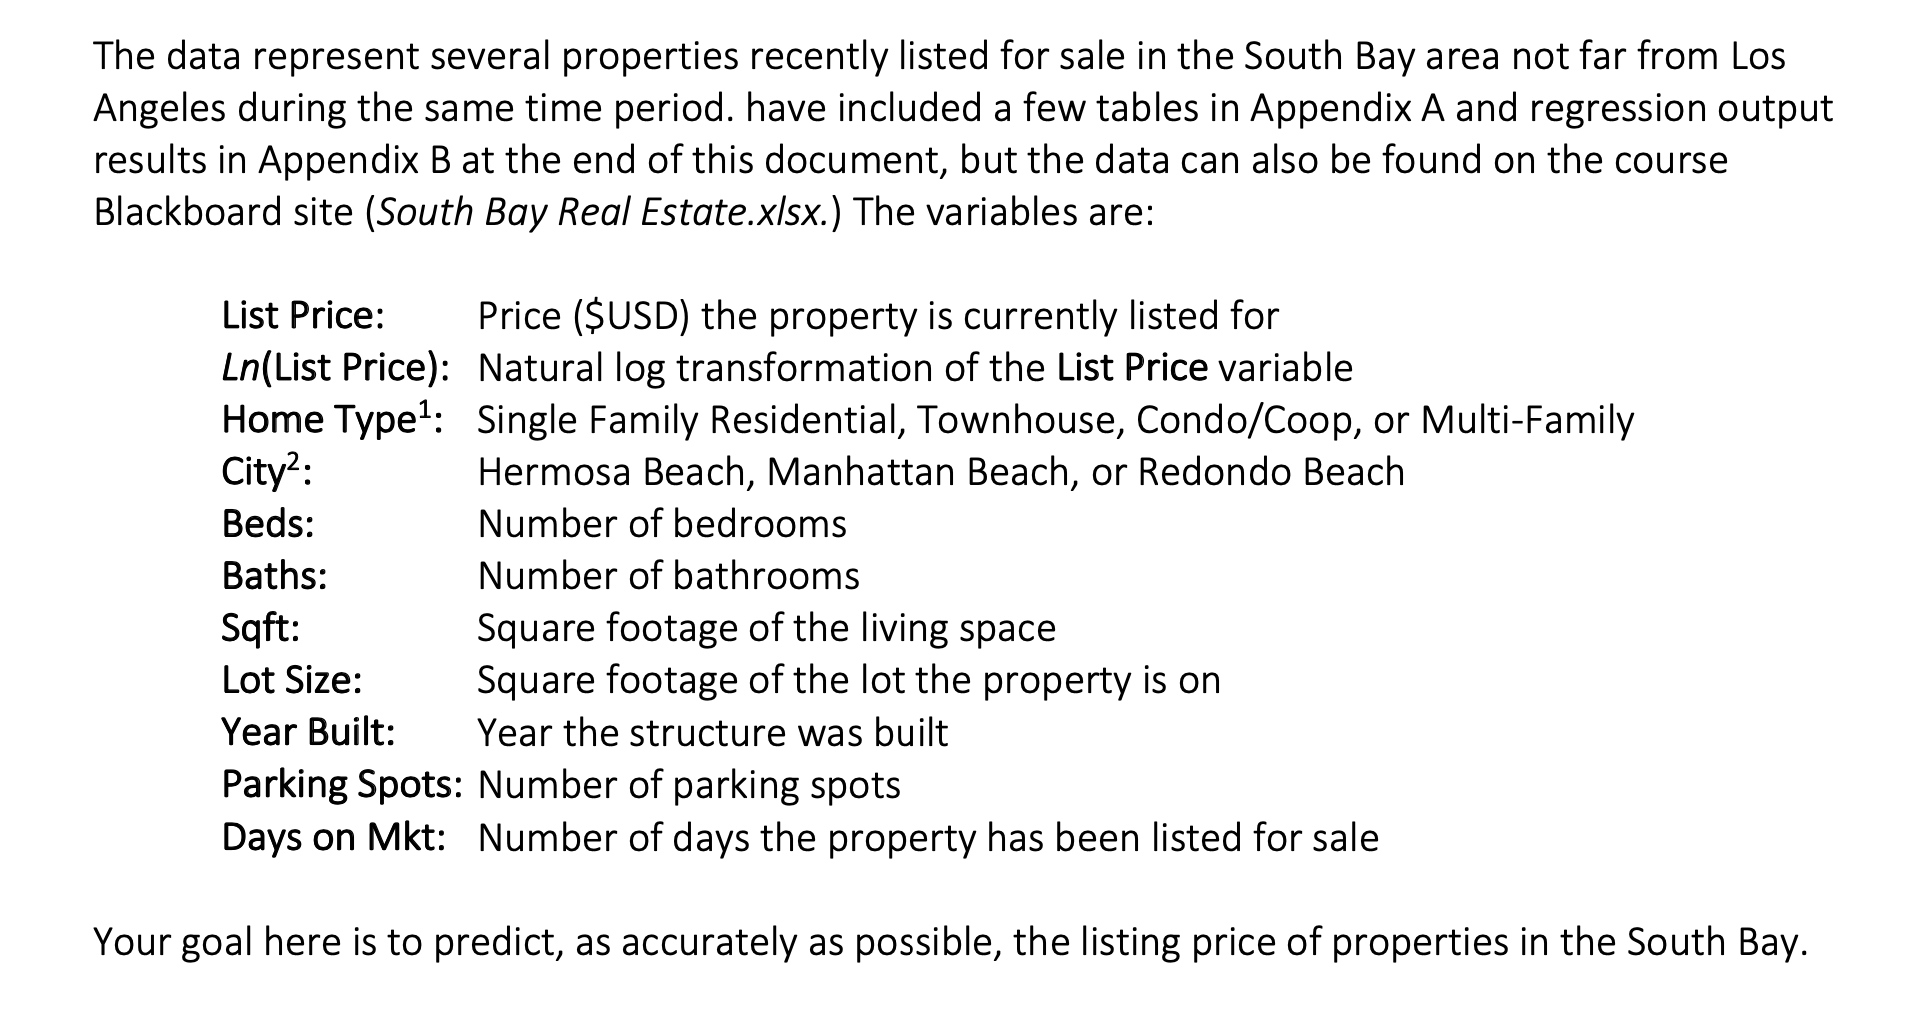

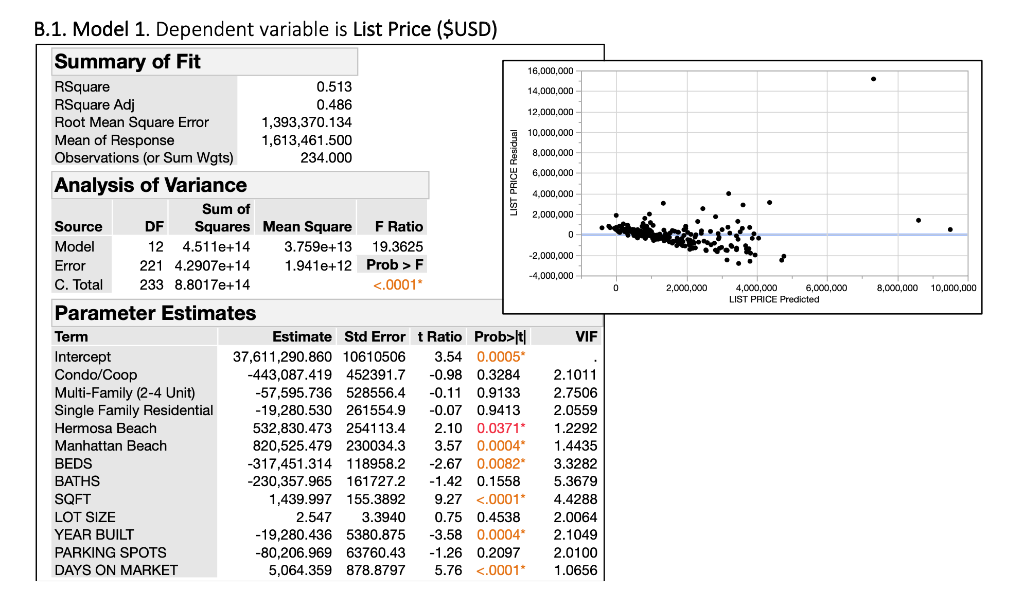
The data represent several properties recently listed for sale in the South Bay area not far from Los Angeles during the same time period. have included a few tables in Appendix A and regression output results in Appendix B at the end of this document, but the data can also be found on the course Blackboard site (South Bay Real Estate.xlsx.) The variables are: List Price: Price ($USD) the property is currently listed for Ln(List Price): Natural log transformation of the List Price variable Home Type1: Single Family Residential, Townhouse, Condo/Coop, or Multi-Family City2: Hermosa Beach, Manhattan Beach, or Redondo Beach Beds: Number of bedrooms Baths: Number of bathrooms Sqft: Square footage of the living space Lot Size: Square footage of the lot the property is on Year Built: Year the structure was built Parking Spots: Number of parking spots Days on Mkt: Number of days the property has been listed for sale Your goal here is to predict, as accurately as possible, the listing price of properties in the South Bay. Model 1 Questions: 3. Why have I excluded Townhouses and Redondo Beach4 from the first model? 4. What 3 items do you think need to be addressed in Model 1, and in what order? 5. Is there a statistically significant relationship between List Price and the 12 independent variables in the model? Justify your answer. 0.486 12.000.00 IST PRICE Residual 0 2 2,000,000 8,000,000 10.000.000 B.1. Model 1. Dependent variable is List Price ($USD) Summary of Fit 16,000,000 RSquare 0.513 14,000,000 RSquare Adj Root Mean Square Error 1,393,370.134 10.000.000 Mean of Response 1,613,461.500 Observations (or Sum Wgts) 234.000 8,000,000 6.000,000 Analysis of Variance 4,000,000 Sum of 2,000,000 Source DF Squares Mean Square F Ratio Model 12 4.511e+14 3.759e+13 19.3625 -2,000,000 Error 221 4.2907e+14 1.941e+12 Prob > F -4,000,000 C. Total 233 8.8017e+14 <.0001 parameter estimates term estimate std error t ratio prob>|t| VIF Intercept 37,611,290.860 10610506 3.54 0.0005 Condo/Coop -443,087.419 452391.7 -0.98 0.3284 2.1011 Multi-Family (2-4 Unit) -57,595.736 528556.4 -0.11 0.9133 2.7506 Single Family Residential -19,280.530 261554.9 -0.07 0.9413 2.0559 Hermosa Beach 532,830.473 254113.4 2.10 0.0371 1.2292 Manhattan Beach 820,525.479 230034.3 3.57 0.0004 1.4435 BEDS -317,451.314 118958.2 -2.67 0.0082 3.3282 BATHS -230,357.965 161727.2 -1.42 0.1558 5.3679 SQFT 1,439.997 155.3892 9.27 <.0001 lot size year built parking spots days on market list price predicted the data represent several properties recently listed for sale in south bay area not far from los angeles during same time period. have included a few tables appendix and regression output results b at end of this document but can also be found course blackboard site real estate.xlsx. variables are: price: property is currently ln natural log transformation variable home type1: single family residential townhouse condo or multi-family city2: hermosa beach manhattan redondo beds: number bedrooms baths: bathrooms sqft: square footage living space size: built: structure was spots: mkt: has been your goal here to predict as accurately possible listing bay. model questions: why i excluded townhouses beach4 first what items do you think need addressed order there statistically significant relationship between independent justify answer. ist residual b.1. dependent summary fit rsquare adj root mean error response observations sum wgts analysis variance source df squares f ratio prob> F -4,000,000 C. Total 233 8.8017e+14 <.0001 parameter estimates term estimate std error t ratio prob>|t| VIF Intercept 37,611,290.860 10610506 3.54 0.0005 Condo/Coop -443,087.419 452391.7 -0.98 0.3284 2.1011 Multi-Family (2-4 Unit) -57,595.736 528556.4 -0.11 0.9133 2.7506 Single Family Residential -19,280.530 261554.9 -0.07 0.9413 2.0559 Hermosa Beach 532,830.473 254113.4 2.10 0.0371 1.2292 Manhattan Beach 820,525.479 230034.3 3.57 0.0004 1.4435 BEDS -317,451.314 118958.2 -2.67 0.0082 3.3282 BATHS -230,357.965 161727.2 -1.42 0.1558 5.3679 SQFT 1,439.997 155.3892 9.27 <.0001 lot size year built parking spots days on market list price predicted>