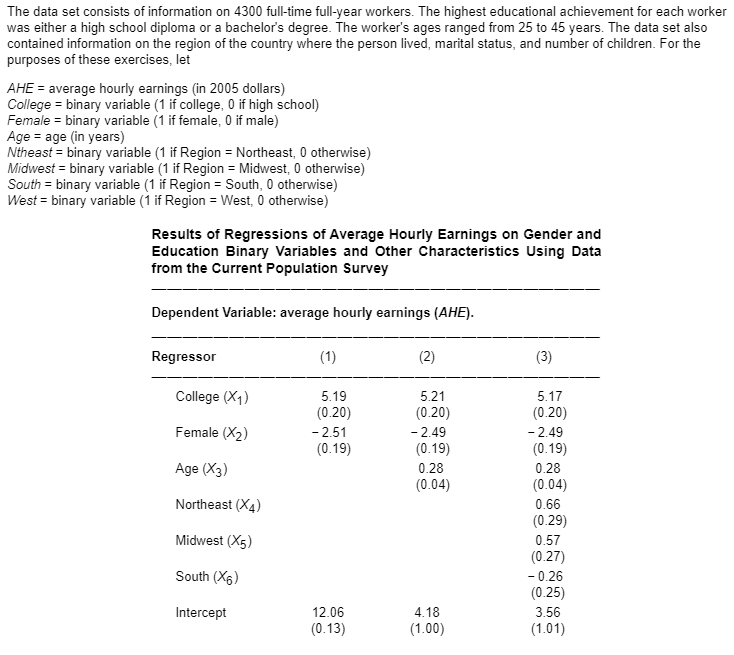
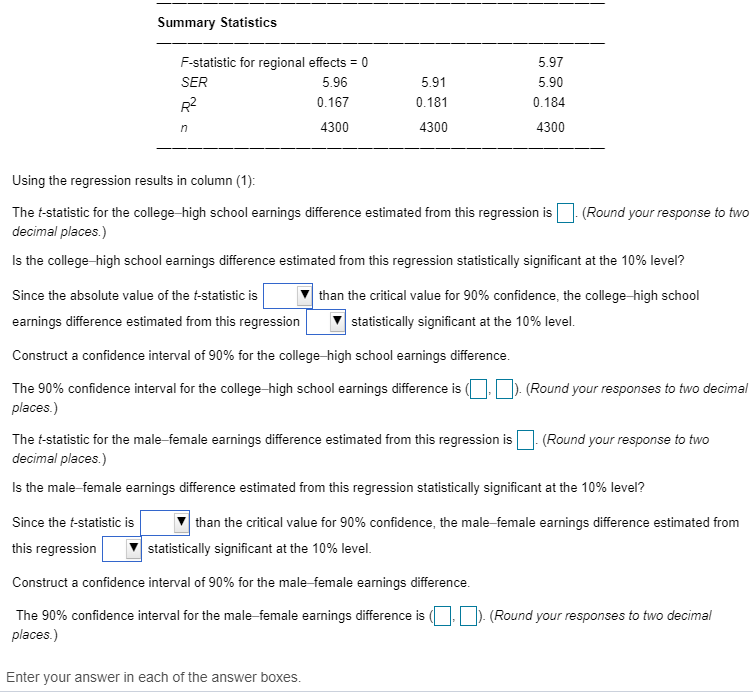
The data set consists of information on 4300 full-time full-year workers. The highest educational achievement for each worker was either a high school diploma or a bachelor's degree. The worker's ages ranged from 25 to 45 years. The data set also contained information on the region of the country where the person lived, marital status and number of children. For the purposes of these exercises, let AHE = average hourly earnings in 2005 dollars) College = binary variable (1 if college, 0 if high school) Female = binary variable (1 if female, 0 if male) Age = age in years) Ntheast = binary variable (1 if Region = Northeast 0 otherwise) Midwest = binary variable (1 if Region = Midwest, 0 otherwise) South = binary variable (1 if Region = South, 0 otherwise) West = binary variable (1 if Region = West, 0 otherwise) Results of Regressions of Average Hourly Earnings on Gender and Education Binary Variables and Other Characteristics Using Data from the Current Population Survey Dependent Variable: average hourly earnings (AHE). Regressor (1) (3) College (X1) 5.19 (0.20) - 2.51 (0.19) Female (X2) 5.21 (0.20) -2.49 (0.19) 0.28 (0.04) Age (X3) Northeast (X4) 5.17 (0.20) -2.49 (0.19) 0.28 (0.04) 0.66 (0.29) 0.57 (0.27) -0.26 (0.25) 3.56 (1.01) Midwest (X5) South (X) Intercept 12.06 (0.13) 4.18 (1.00) Summary Statistics F-statistic for regional effects = 0 SER 5.96 0.167 4300 5.91 0.181 5.97 5.90 0.184 4300 4300 Using the regression results in column (1): The t-statistic for the college-high school earnings difference estimated from this regression is (Round your response to two decimal places.) Is the college high school earnings difference estimated from this regression statistically significant at the 10% level? Since the absolute value of the t-statistic is v than the critical value for 90% confidence, the college-high school earnings difference estimated from this regression statistically significant at the 10% level. Construct a confidence interval of 90% for the college high school earnings difference. . (Round your responses to two decimal The 90% confidence interval for the college-high school earnings difference is places.) - (Round your response to two The t-statistic for the male-female earnings difference estimated from this regression is decimal places.) Is the male-female earnings difference estimated from this regression statistically significant at the 10% level? Since the t-statistic is this regression than the critical value for 90% confidence, the male female earnings difference estimated from statistically significant at the 10% level. Construct a confidence interval of 90% for the male-female earnings difference. O ). (Round your responses to two decimal The 90% confidence interval for the male female earnings difference is N places.) Enter your answer in each of the answer boxes. The data set consists of information on 4300 full-time full-year workers. The highest educational achievement for each worker was either a high school diploma or a bachelor's degree. The worker's ages ranged from 25 to 45 years. The data set also contained information on the region of the country where the person lived, marital status and number of children. For the purposes of these exercises, let AHE = average hourly earnings in 2005 dollars) College = binary variable (1 if college, 0 if high school) Female = binary variable (1 if female, 0 if male) Age = age in years) Ntheast = binary variable (1 if Region = Northeast 0 otherwise) Midwest = binary variable (1 if Region = Midwest, 0 otherwise) South = binary variable (1 if Region = South, 0 otherwise) West = binary variable (1 if Region = West, 0 otherwise) Results of Regressions of Average Hourly Earnings on Gender and Education Binary Variables and Other Characteristics Using Data from the Current Population Survey Dependent Variable: average hourly earnings (AHE). Regressor (1) (3) College (X1) 5.19 (0.20) - 2.51 (0.19) Female (X2) 5.21 (0.20) -2.49 (0.19) 0.28 (0.04) Age (X3) Northeast (X4) 5.17 (0.20) -2.49 (0.19) 0.28 (0.04) 0.66 (0.29) 0.57 (0.27) -0.26 (0.25) 3.56 (1.01) Midwest (X5) South (X) Intercept 12.06 (0.13) 4.18 (1.00) Summary Statistics F-statistic for regional effects = 0 SER 5.96 0.167 4300 5.91 0.181 5.97 5.90 0.184 4300 4300 Using the regression results in column (1): The t-statistic for the college-high school earnings difference estimated from this regression is (Round your response to two decimal places.) Is the college high school earnings difference estimated from this regression statistically significant at the 10% level? Since the absolute value of the t-statistic is v than the critical value for 90% confidence, the college-high school earnings difference estimated from this regression statistically significant at the 10% level. Construct a confidence interval of 90% for the college high school earnings difference. . (Round your responses to two decimal The 90% confidence interval for the college-high school earnings difference is places.) - (Round your response to two The t-statistic for the male-female earnings difference estimated from this regression is decimal places.) Is the male-female earnings difference estimated from this regression statistically significant at the 10% level? Since the t-statistic is this regression than the critical value for 90% confidence, the male female earnings difference estimated from statistically significant at the 10% level. Construct a confidence interval of 90% for the male-female earnings difference. O ). (Round your responses to two decimal The 90% confidence interval for the male female earnings difference is N places.) Enter your answer in each of the answer boxes