Answered step by step
Verified Expert Solution
Question
1 Approved Answer
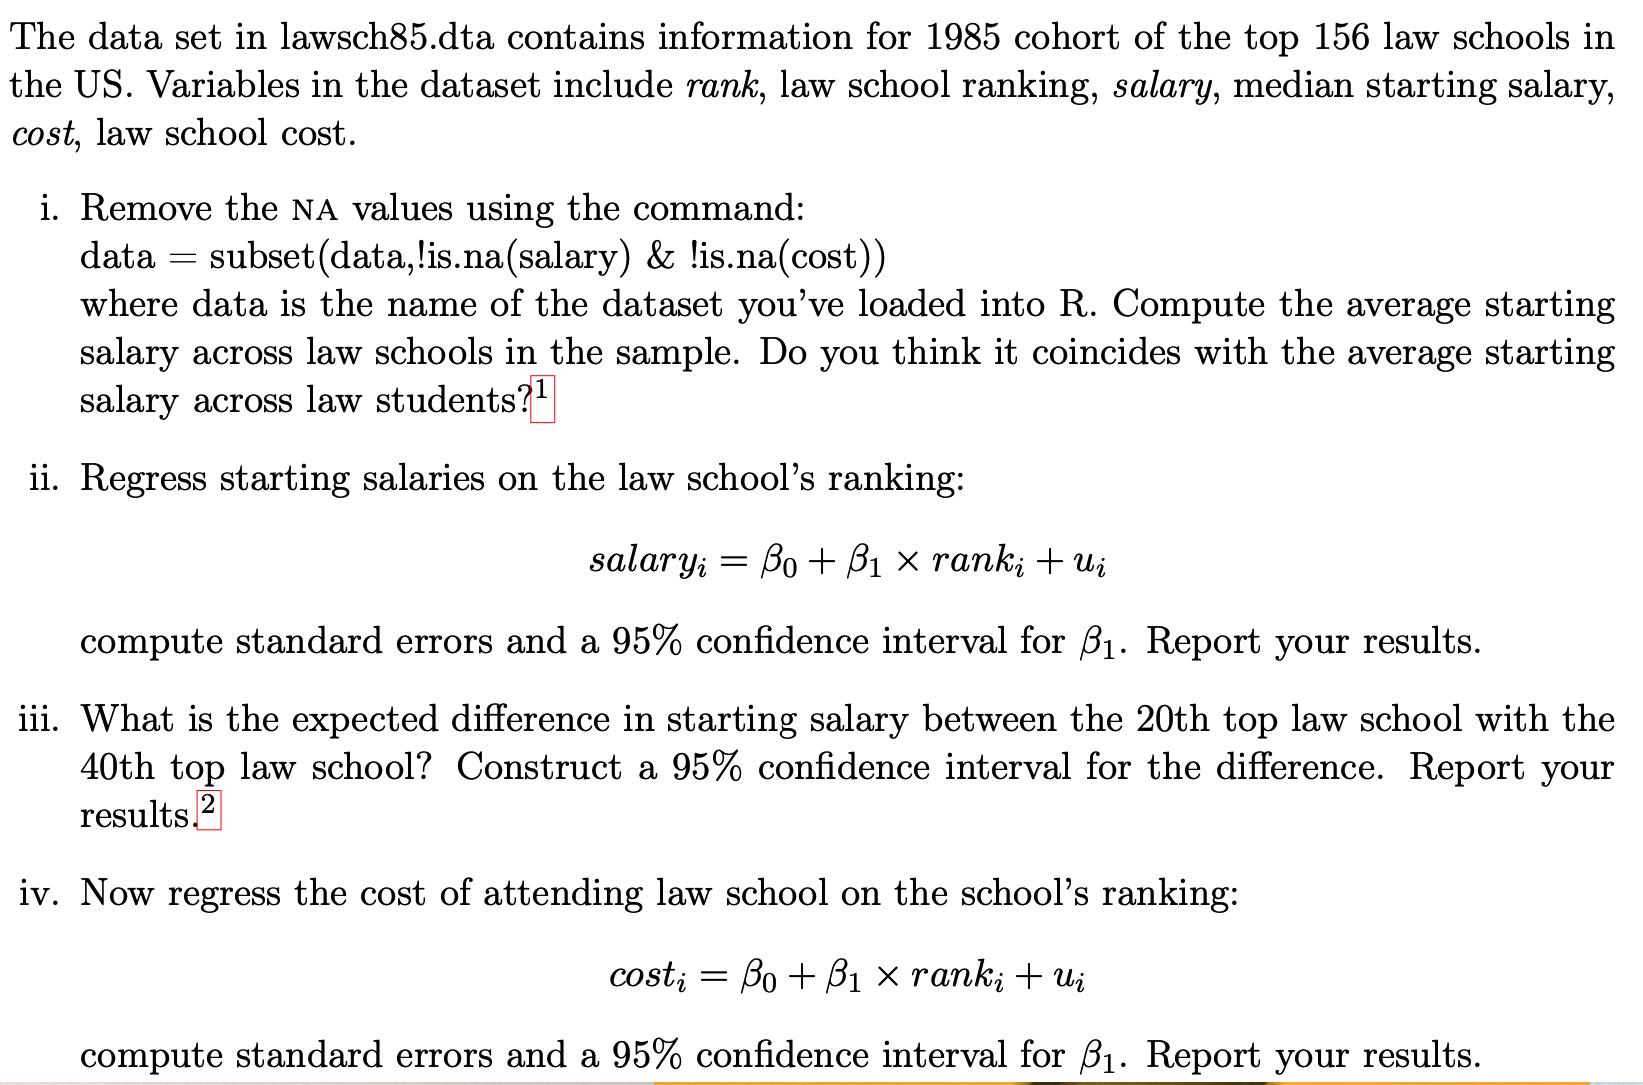
The data set in lawsch85.dta contains information for 1985 cohort of the top 156 law schools in the US. Variables in the dataset include


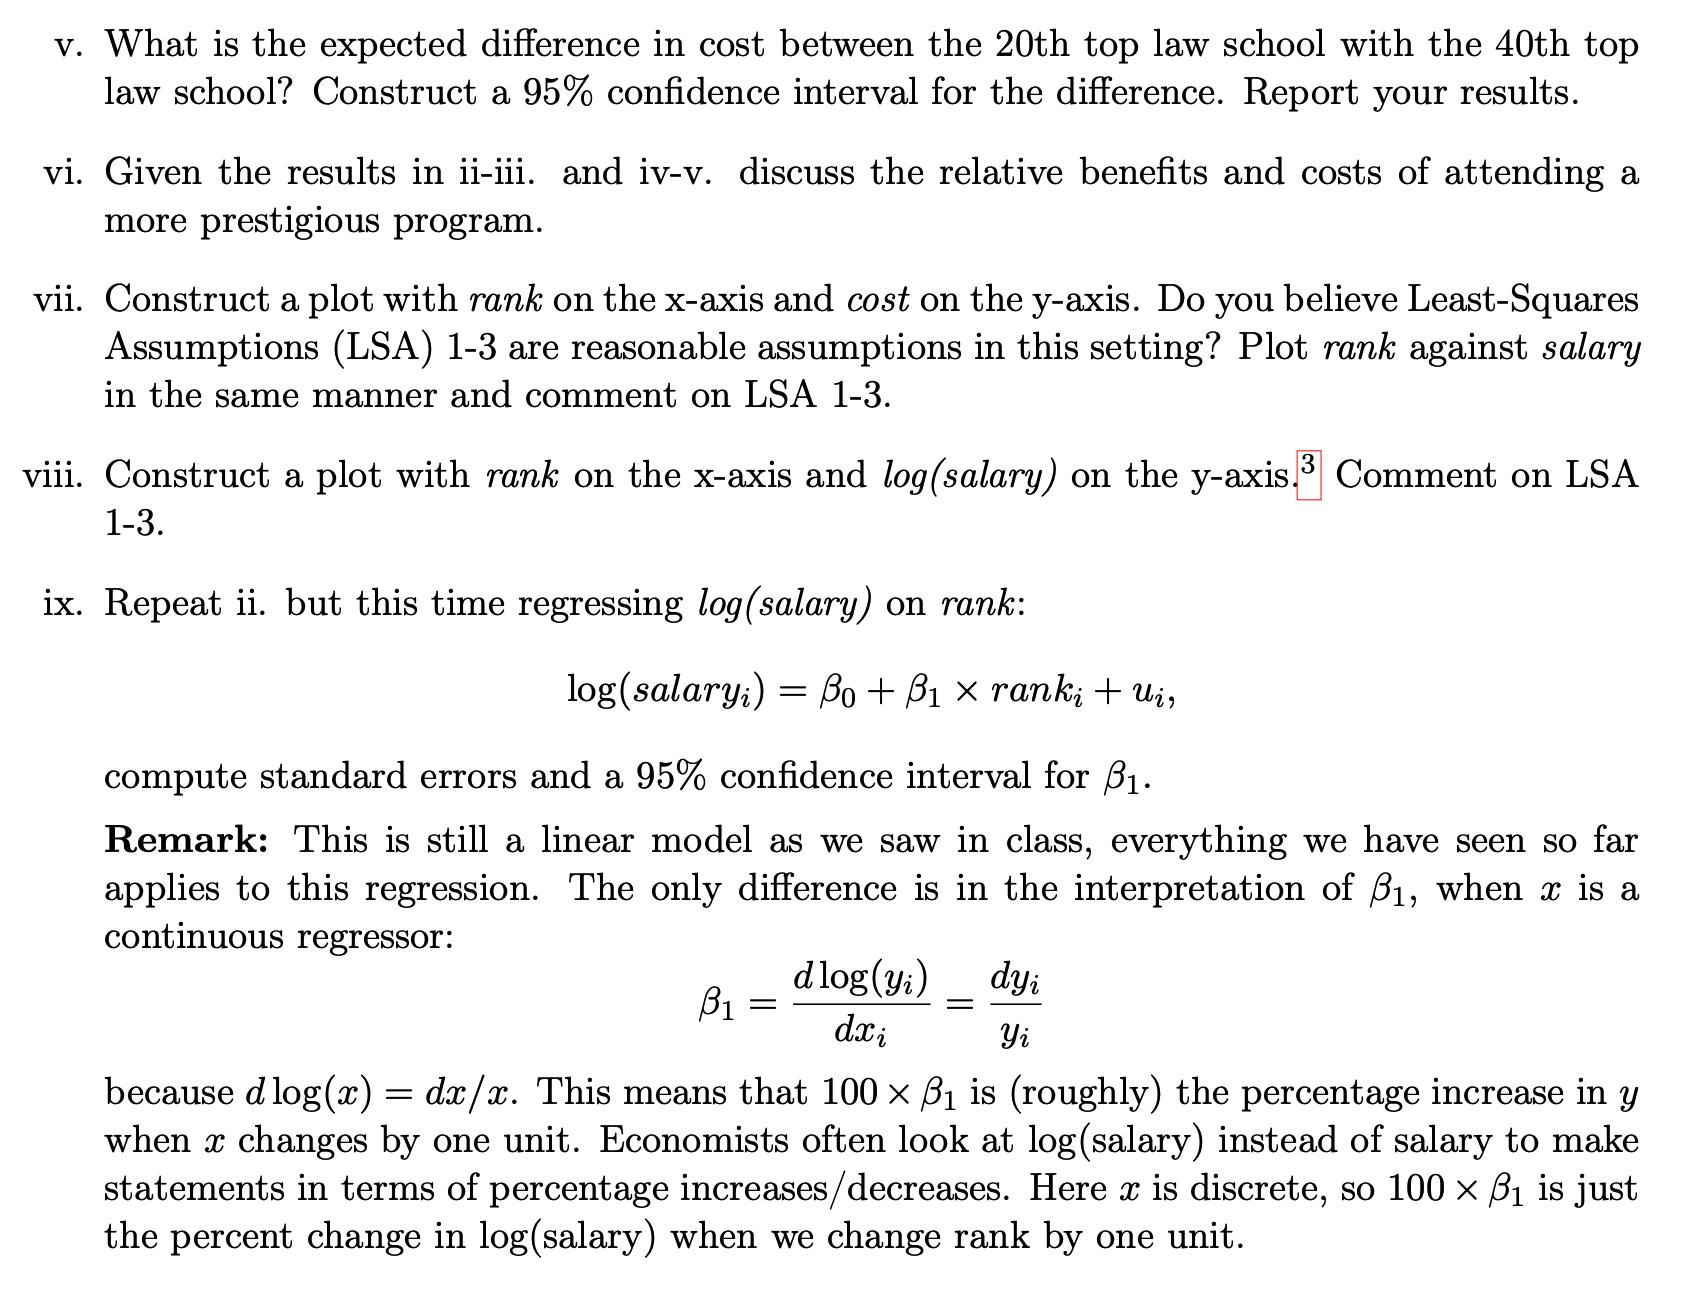
The data set in lawsch85.dta contains information for 1985 cohort of the top 156 law schools in the US. Variables in the dataset include rank, law school ranking, salary, median starting salary, cost, law school cost. i. Remove the NA values using the command: data = subset(data,!is.na(salary) & !is.na(cost)) where data is the name of the dataset you've loaded into R. Compute the average starting salary across law schools in the sample. Do you think it coincides with the average starting salary across law students?1 ii. Regress starting salaries on the law school's ranking: salary; Bo+ 1 rank; + Ui = compute standard errors and a 95% confidence interval for . Report your results. iii. What is the expected difference in starting salary between the 20th top law school with the 40th top law school? Construct a 95% confidence interval for the difference. Report your results. 2 iv. Now regress the cost of attending law school on the school's ranking: cost; = Bo1 ranki + ui compute standard errors and a 95% confidence interval for . Report your results. v. What is the expected difference in cost between the 20th top law school with the 40th top law school? Construct a 95% confidence interval for the difference. Report your results. vi. Given the results in ii-iii. and iv-v. discuss the relative benefits and costs of attending a more prestigious program. vii. Construct a plot with rank on the x-axis and cost on the y-axis. Do you believe Least-Squares Assumptions (LSA) 1-3 are reasonable assumptions in this setting? Plot rank against salary. in the same manner and comment on LSA 1-3. viii. Construct a plot with rank on the x-axis and log(salary) on the y-axis. 3 Comment on LSA 1-3. ix. Repeat ii. but this time regressing log(salary) on rank: log(salary) = 0 + B ranki + Ui, compute standard errors and a 95% confidence interval for 1. Remark: This is still a linear model as we saw in class, everything we have seen so far applies to this regression. The only difference is in the interpretation of 1, when x is a continuous regressor: because d log(x) = = d log(yi) dxi = dyi Yi dx/x. This means that 100 is (roughly) the percentage increase in y when x changes by one unit. Economists often look at log(salary) instead of salary to make statements in terms of percentage increases/decreases. Here x is discrete, so 100 is just the percent change in log(salary) when we change rank by one unit.
Step by Step Solution
There are 3 Steps involved in it
Step: 1

Get Instant Access to Expert-Tailored Solutions
See step-by-step solutions with expert insights and AI powered tools for academic success
Step: 2

Step: 3

Ace Your Homework with AI
Get the answers you need in no time with our AI-driven, step-by-step assistance
Get Started


