Answered step by step
Verified Expert Solution
Question
1 Approved Answer
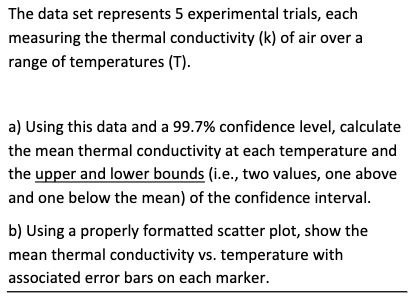
The data set represents 5 experimental trials, each measuring the thermal conductivity ( k ) of air over a range of temperatures ( T )
The data set represents experimental trials, each
measuring the thermal conductivity of air over a
range of temperatures
a Using this data and a confidence level, calculate
the mean thermal conductivity at each temperature and
the upper and lower bounds ie two values, one above
and one below the mean of the confidence interval.
b Using a properly formatted scatter plot, show the
mean thermal conductivity vs temperature with
associated error bars on each marker.

Step by Step Solution
There are 3 Steps involved in it
Step: 1

Get Instant Access to Expert-Tailored Solutions
See step-by-step solutions with expert insights and AI powered tools for academic success
Step: 2

Step: 3

Ace Your Homework with AI
Get the answers you need in no time with our AI-driven, step-by-step assistance
Get Started


