

Question
The data shown in the following table are sample corporate data on 10 U.S. public utility companies. We are interested in forming groups of similar
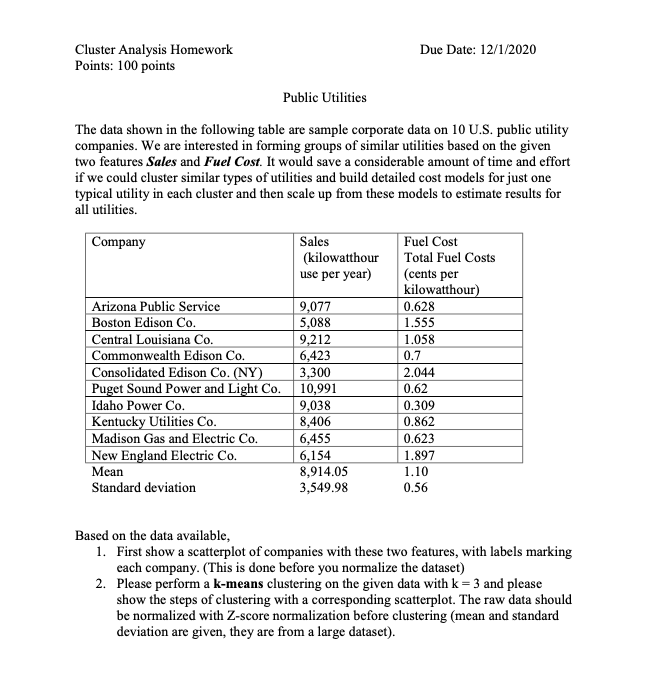
The data shown in the following table are sample corporate data on 10 U.S. public utility companies. We are interested in forming groups of similar utilities based on the given two features Sales and Fuel Cost. It would save a considerable amount of time and effort if we could cluster similar types of utilities and build detailed cost models for just one typical utility in each cluster and then scale up from these models to estimate results for all utilities.
Based on the data available,
- First show a scatterplot of companies with these two features, with labels marking each company. (This is done before you normalize the dataset)
- Please perform a k-means clustering on the given data with k = 3 and please show the steps of clustering with a corresponding scatterplot. The raw data should be normalized with Z-score normalization before clustering (mean and standard deviation are given, they are from a large dataset).
Step by Step Solution
There are 3 Steps involved in it
Step: 1

Get Instant Access to Expert-Tailored Solutions
See step-by-step solutions with expert insights and AI powered tools for academic success
Step: 2

Step: 3
Ace Your Homework with AI
Get the answers you need in no time with our AI-driven, step-by-step assistance
Get Started
An Introduction to Measure Theoretic Probability
Authors: George G. Roussas
2nd edition
128000422, 978-0128000427