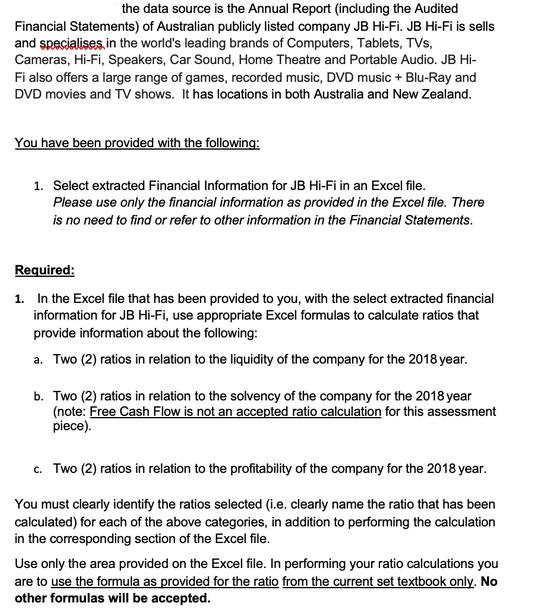
Question: the data source is the Annual Report (including the Audited Financial Statements) of Australian publicly listed company JB Hi-Fi. JB Hi-Fi is sells and


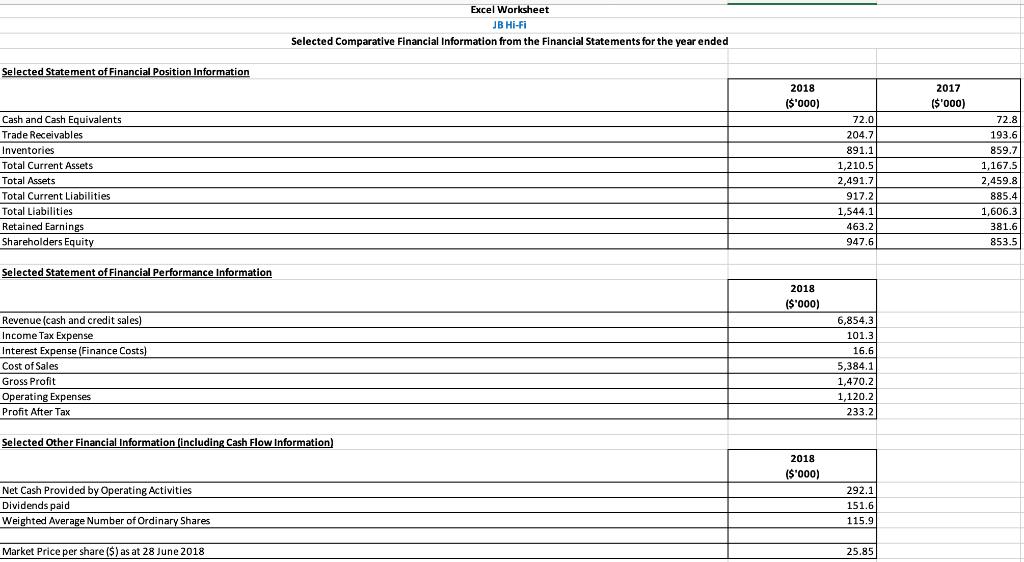
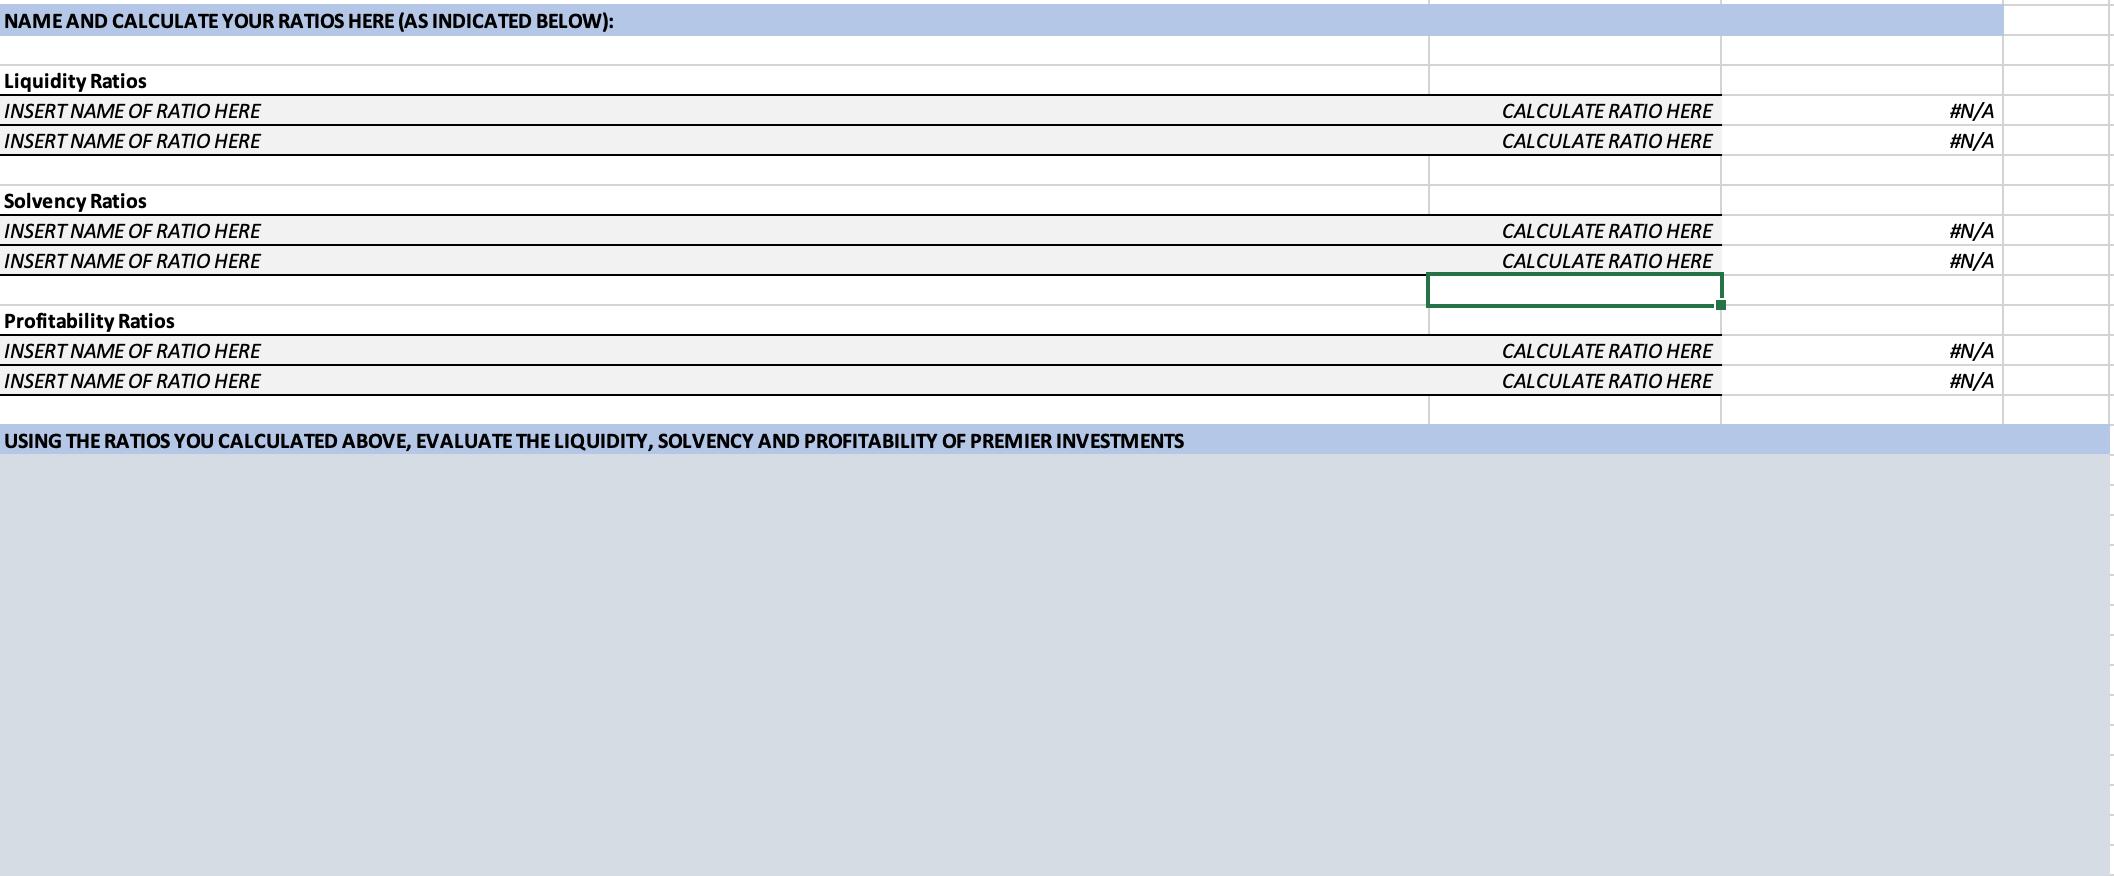
the data source is the Annual Report (including the Audited Financial Statements) of Australian publicly listed company JB Hi-Fi. JB Hi-Fi is sells and specialises in the world's leading brands of Computers, Tablets, TVs, Cameras, Hi-Fi, Speakers, Car Sound, Home Theatre and Portable Audio. JB Hi- Fi also offers a large range of games, recorded music, DVD music + Blu-Ray and DVD movies and TV shows. It has locations in both Australia and New Zealand. You have been provided with the following: 1. Select extracted Financial Information for JB Hi-Fi in an Excel file. Please use only the financial information as provided in the Excel file. There is no need to find or refer to other information in the Financial Statements. Required: 1. In the Excel file that has been provided to you, with the select extracted financial information for JB Hi-Fi, use appropriate Excel formulas to calculate ratios that provide information about the following: a. Two (2) ratios in relation to the liquidity of the company for the 2018 year. b. Two (2) ratios in relation to the solvency of the company for the 2018 year (note: Free Cash Flow is not an accepted ratio calculation for this assessment piece). c. Two (2) ratios in relation to the profitability of the company for the 2018 year. You must clearly identify the ratios selected (i.e. clearly name the ratio that has been calculated) for each of the above categories, in addition to performing the calculation in the corresponding section of the Excel file. Use only the area provided on the Excel file. In performing your ratio calculations you are to use the formula as provided for the ratio from the current set textbook only. No other formulas will be accepted. Selected Statement of Financial Position Information Cash and Cash Equivalents Trade Receivables Inventories Total Current Assets Total Assets Total Current Liabilities Total Liabilities Retained Earnings. Shareholders Equity Selected Statement of Financial Performance Information Revenue (cash and credit sales) Income Tax Expense Interest Expense (Finance Costs) Cost of Sales Gross Profit Operating Expenses Profit After Tax Selected Other Financial Information (including Cash Flow Information) Net Cash Provided by Operating Activities Dividends paid Weighted Average Number of Ordinary Shares Excel Worksheet JB Hi-Fi Selected Comparative Financial Information from the Financial Statements for the year ended Market Price per share ($) as at 28 June 2018 2018 ($'000) 2018 ($'000) 2018 ($'000) 72.0 204.7 891.1 1,210.5 2,491.7 917.2 1,544.1 463.2 947.6 6,854.3 101.3 16.6 5,384.1 1,470.2 1,120.2 233.2 292.1 151.6 115.9 25.85 2017 ($'000) 72.8 193.6 859.7 1,167.5 2,459.8 885.4 1,606.3 381.6 853.5 NAME AND CALCULATE YOUR RATIOS HERE (AS INDICATED BELOW): Liquidity Ratios INSERT NAME OF RATIO HERE INSERT NAME OF RATIO HERE Solvency Ratios INSERT NAME OF RATIO HERE INSERT NAME OF RATIO HERE Profitability Ratios INSERT NAME OF RATIO HERE INSERT NAME OF RATIO HERE USING THE RATIOS YOU CALCULATED ABOVE, EVALUATE THE LIQUIDITY, SOLVENCY AND PROFITABILITY OF PREMIER INVESTMENTS CALCULATE RATIO HERE CALCULATE RATIO HERE CALCULATE RATIO HERE CALCULATE RATIO HERE CALCULATE RATIO HERE CALCULATE RATIO HERE #N/A #N/A #N/A #N/A #N/A #N/A
Step by Step Solution
3.41 Rating (151 Votes )
There are 3 Steps involved in it
aLIQUIDITY RATIOS 1Current RatioTotal Current assetsTotal Current Liabilities121059172 132 Current R... View full answer

Get step-by-step solutions from verified subject matter experts


