Answered step by step
Verified Expert Solution
Question
1 Approved Answer
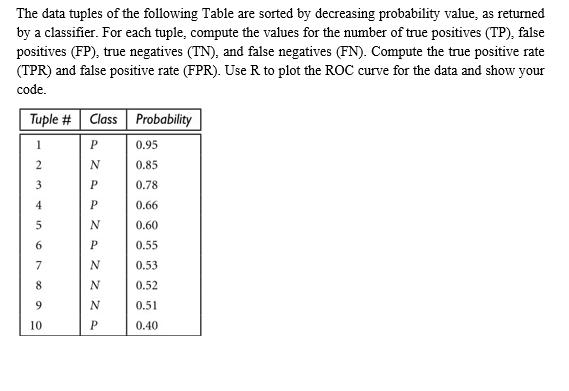
The data tuples of the following Table are sorted by decreasing probability value, as returned by a classifier. For each tuple, compute the values

The data tuples of the following Table are sorted by decreasing probability value, as returned by a classifier. For each tuple, compute the values for the number of true positives (TP), false positives (FP), true negatives (TN), and false negatives (FN). Compute the true positive rate (TPR) and false positive rate (FPR). Use R to plot the ROC curve for the data and show your code. Tuple # Class Probability 0.95 0.85 3 0.78 4 0.66 N 0.60 6 P. 0.55 7. 0.53 8 0.52 9 0.51 10 0.40
Step by Step Solution
★★★★★
3.38 Rating (151 Votes )
There are 3 Steps involved in it
Step: 1
true sitive is n utme where the mdel rretly redits the sitive lss 095078066055040334 True ...
Get Instant Access to Expert-Tailored Solutions
See step-by-step solutions with expert insights and AI powered tools for academic success
Step: 2

Step: 3

Document Format ( 2 attachments)
6360747a7eb6b_232003.pdf
180 KBs PDF File
6360747a7eb6b_232003.docx
120 KBs Word File
Ace Your Homework with AI
Get the answers you need in no time with our AI-driven, step-by-step assistance
Get Started


