

Question
The dataset you will analyze in this HW is the Wine dataset. The dataset consists of the following variables. You will cluster the wines into
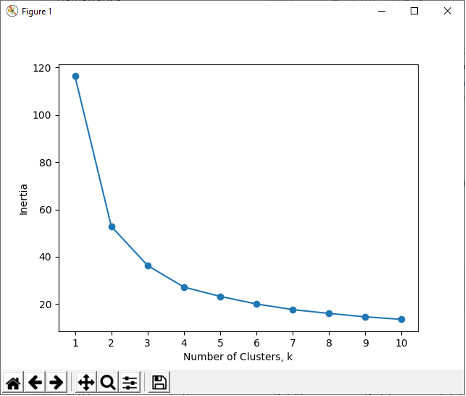
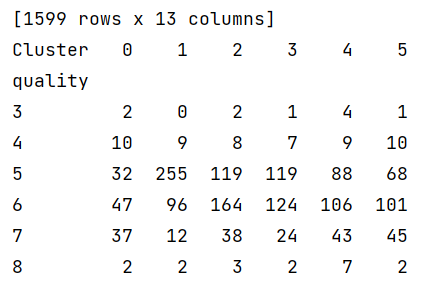
The dataset you will analyze in this HW is the Wine dataset. The dataset consists of the following variables. You will cluster the wines into several clusters based on the following attributes. Description of attributes: 1 - fixed acidity: most acids involved with wine or fixed or nonvolatile (do not evaporate readily) 2 - volatile acidity: the amount of acetic acid in wine, which at too high of levels can lead to an unpleasant, vinegar taste 3 - citric acid: found in small quantities, citric acid can add 'freshness' and flavor to wines 4 - residual sugar: the amount of sugar remaining after fermentation stops, it's rare to find wines with less than 1 gram/liter and wines with greater than 45 grams/liter are considered sweet 5 - chlorides: the amount of salt in the wine 6 - free sulfur dioxide: the free form of SO2 exists in equilibrium between molecular SO2 (as a dissolved gas) and bisulfite ion; it prevents microbial growth and the oxidation of wine 7 - total sulfur dioxide: amount of free and bound forms of S02; in low concentrations, SO2 is mostly undetectable in wine, but at free SO2 concentrations over 50 ppm, SO2 becomes evident in the nose and taste of wine 8 - density: the density of water is close to that of water depending on the percent alcohol and sugar content 9 - pH: describes how acidic or basic a wine is on a scale from 0 (very acidic) to 14 (very basic); most wines are between 3-4 on the pH scale 10 - sulphates: a wine additive which can contribute to sulfur dioxide gas (S02) levels, wich acts as an antimicrobial and antioxidant 11 - alcohol: the percent alcohol content of the wine 12 - quality (score between 0 and 10) Dataset is posted on Blackboard. Problem 1. Read the dataset into a dataframe. Be sure to import the header. (2) 2. Drop Wine from the dataframe. (1) 3. Extract Quality and store it in a separate variable. (1) 4. Drop Quality from dataframe. (1) 5. Print the dataframe and Quality. (1) 6. Normalize all columns of the dataframe. Use the Normalizer class from sklearn.preprocessing. (2) 7. Print the normalized dataframe. (1) 8. Create a range of k values from 1:11 for KMeans clustering. Iterate on the k values and store the inertia for each clustering in a list. (2) 9. Plot the chart of inertia vs number of clusters. (2) 10. What K (number of clusters) would you pick for KMeans? (1) 11. Now cluster the wines into K clusters. Use random_state = 2023 when you instantiate the KMeans model. Assign the respective cluster number to each wine. Print the dataframe showing the cluster number for each wine. (2) 12. Add the quality back to the dataframe. (1) 13. Now print a crosstab (from Pandas) of cluster number vs quality. Comment if the clusters represent the quality of wine. (3)
Step by Step Solution
There are 3 Steps involved in it
Step: 1

Get Instant Access to Expert-Tailored Solutions
See step-by-step solutions with expert insights and AI powered tools for academic success
Step: 2

Step: 3
Ace Your Homework with AI
Get the answers you need in no time with our AI-driven, step-by-step assistance
Get Started
SQL Server T-SQL Recipes
Authors: David Dye, Jason Brimhall
4th Edition
1484200616, 9781484200612