Answered step by step
Verified Expert Solution
Question
1 Approved Answer
The Decomposition of Nitrogen Dioxide Introduction The applications of chemistry focus primarily on chemical reactions, processes that are defined by their reactants (substances that


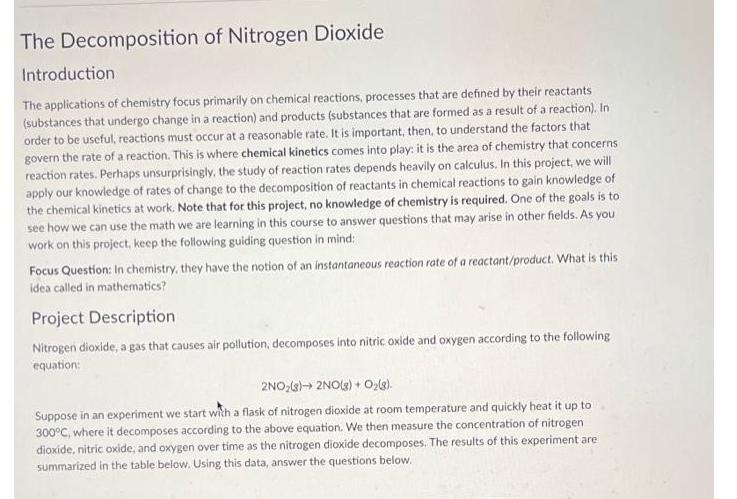
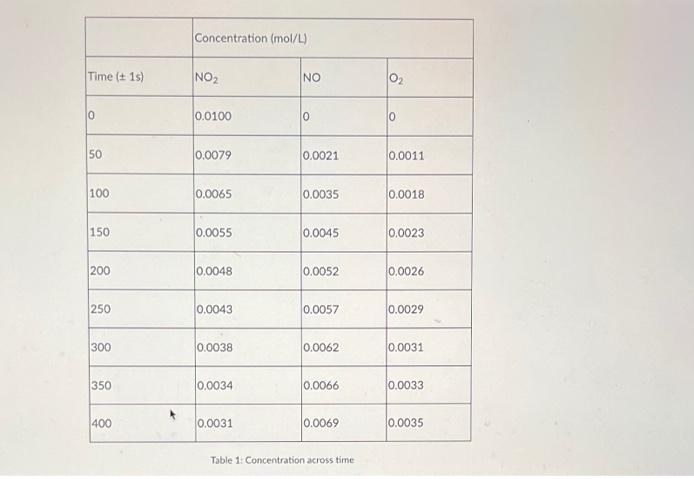
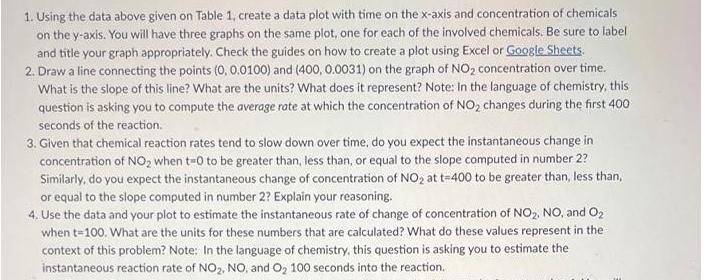
The Decomposition of Nitrogen Dioxide Introduction The applications of chemistry focus primarily on chemical reactions, processes that are defined by their reactants (substances that undergo change in a reaction) and products (substances that are formed as a result of a reaction). In order to be useful, reactions must occur at a reasonable rate. It is important, then, to understand the factors that govern the rate of a reaction. This is where chemical kinetics comes into play: it is the area of chemistry that concerns reaction rates. Perhaps unsurprisingly, the study of reaction rates depends heavily on calculus. In this project, we will apply our knowledge of rates of change to the decomposition of reactants in chemical reactions to gain knowledge of the chemical kinetics at work. Note that for this project, no knowledge of chemistry is required. One of the goals is to see how we can use the math we are learning in this course to answer questions that may arise in other fields. As you work on this project, keep the following guiding question in mind: Focus Question: In chemistry, they have the notion of an instantaneous reaction rate of a reactant/product. What is this idea called in mathematics? Project Description Nitrogen dioxide, a gas that causes air pollution, decomposes into nitric oxide and oxygen according to the following equation: 2NO(g) 2NO(g) + O(g). Suppose in an experiment we start with a flask of nitrogen dioxide at room temperature and quickly heat it up to 300C, where it decomposes according to the above equation. We then measure the concentration of nitrogen dioxide, nitric oxide, and oxygen over time as the nitrogen dioxide decomposes. The results of this experiment are summarized in the table below. Using this data, answer the questions below. Time ( 1s) 0 50 100 150 200 250 300 350 400 Concentration (mol/L) NO 0.0100 0.0079 0.0065 0.0055 0.0048 0.0043 0.0038 0.0034 0.0031 NO 0 0.0021 0.0035 0.0045 0.0052 0.0057 0.0062 0.0066 0.0069 Table 1: Concentration across time 0 0 0.0011 0.0018 0.0023 0.0026 0.0029 0.0031 0.0033 0.0035 1. Using the data above given on Table 1, create a data plot with time on the x-axis and concentration of chemicals on the y-axis. You will have three graphs on the same plot, one for each of the involved chemicals. Be sure to label and title your graph appropriately. Check the guides on how to create a plot using Excel or Google Sheets. 2. Draw a line connecting the points (0, 0.0100) and (400, 0.0031) on the graph of NO concentration over time. What is the slope of this line? What are the units? What does it represent? Note: In the language of chemistry, this question is asking you to compute the average rate at which the concentration of NO changes during the first 400 seconds of the reaction. 3. Given that chemical reaction rates tend to slow down over time, do you expect the instantaneous change in concentration of NO when t-0 to be greater than, less than, or equal to the slope computed in number 2? Similarly, do you expect the instantaneous change of concentration of NO at t-400 to be greater than, less than, or equal to the slope computed in number 2? Explain your reasoning. 4. Use the data and your plot to estimate the instantaneous rate of change of concentration of NO, NO, and O when t=100. What are the units for these numbers that are calculated? What do these values represent in the context of this problem? Note: In the language of chemistry, this question is asking you to estimate the instantaneous reaction rate of NO, NO, and O 100 seconds into the reaction.
Step by Step Solution
★★★★★
3.44 Rating (144 Votes )
There are 3 Steps involved in it
Step: 1
The detailed ...
Get Instant Access to Expert-Tailored Solutions
See step-by-step solutions with expert insights and AI powered tools for academic success
Step: 2

Step: 3

Ace Your Homework with AI
Get the answers you need in no time with our AI-driven, step-by-step assistance
Get Started


