

Answered step by step
Verified Expert Solution
Question
1 Approved Answer
The Department of Health of a certain state estimates a 10% rate of HIV for the at risk population and a 0.3% rate for
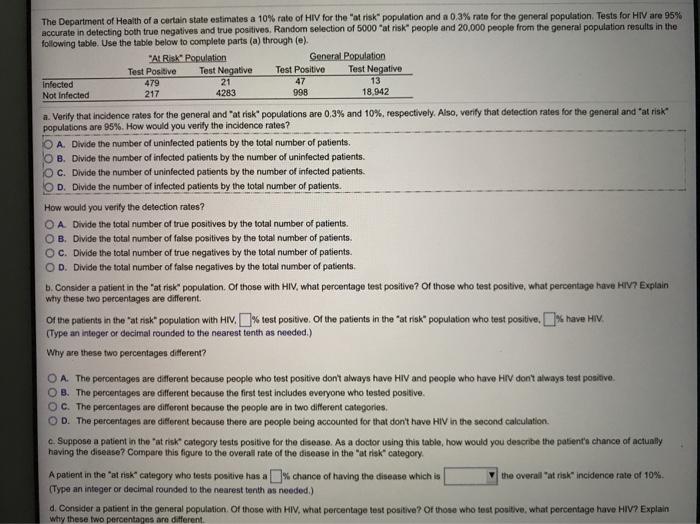
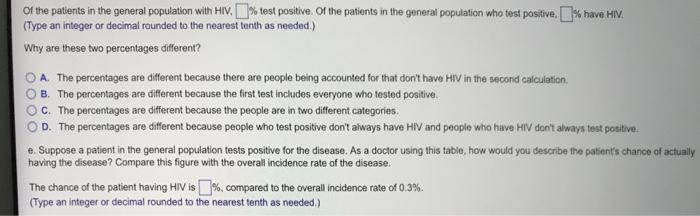
The Department of Health of a certain state estimates a 10% rate of HIV for the "at risk" population and a 0.3% rate for the general population. Tests for HIV are 95% accurate in detecting both true negatives and true positives. Random selection of 5000 "at risk" people and 20,000 people from the general population results in the following table. Use the table below to complete parts (a) through (e). "AL Risk Population Test Positive 479 217 Test Negative 21 4283 General Population Test Negative 13 18.942 Test Positive Infected Not Infected 47 998 a. Verify that incidence rates for the general and "at risk" populations are 0,3% and 10%, respectively. Also, verify that detection rates for the general and "at risk populations are 95%. How would you verify the incidence rates? A. Divide the number of uninfected patients by the total number of patients. O B. Divide the number of infected patients by the number of uninfected patients. OC. Divide the number of uninfected patients by the number of infected patients. O D. Divide the number of infected patients by the total number of patlents. How would you verify the detection rates? OA Divide the total number of true positives by the total number of patients. OB. Divide the total number of false positives by the total number of patients. OC. Divide the total number of true negatives by the total number of patients. O D. Divide the total number of false negatives by the total number of patients. b. Consider a patient in the "at risk" population. Or those with HIV, what percentage test positive? Of those who test positive, what percentage have HIV? Explain why these two percentages are different. Of the patients in the "at rak population with HIV. % test positive. Of the patients in the "at risk" population who test posive, k have HIV. (Type an integer or decimal rounded to the nearest tenth as needed.) Why are these two percentages different? OA. The percentages are different because people who test positive don't always have HIV and people who have HIV don't always test positive. OB. The percentages are different because the first test includes everyone who tested positive. OC. The percentages are different because the people are in two different categories, O D. The percentages are different because there are people being accounted for that don't have HIV in the second calculation. c. Suppose a patient in the "at risk" category tests positive for the disease. As a doctor using this table, how would you describe the patient's chance of actunly having the disease? Compare this figure to the overall rate of the disease in the "at risk" category. A patient in the "at risk" category who tests positive has a% chance of having the disease which is (Type an integer or decimal rounded to the nearest tenth as needed.) the overall "at risk" incidence rate of 10%. d. Consider a patient in the general population. Of those with HIV, what percentage test positive? Of those who test positive, what percentage have HIV? Explain why these two percentages are different. Of the patients in the general population with HIV. % test positive. Of the patients in the general population who test positive, % have HIV. (Type an integer or decimal rounded to the nearest tenth as needed.) Why are these two percentages different? O A. The percentages are different because there are people being accounted for that don't have HIV in the second calculation. O B. The percentages are different because the first test includes everyone who tested positive. C. The percentages are different because the people are in two different categories. D. The percentages are different because people who test positive dont always have HIV and people who have HIV don't always test positive. e. Suppose a patient in the general population tests positive for the disease. As a doctor using this table, how would you describe the patient's chance of actually having the disease? Compare this figure with the overall incidence rate of the disease. The chance of the patient having HIV is %. compared to the overall incidence rate of 0.3%. (Type an integer or decimal rounded to the nearest tenth as needed.)
Step by Step Solution
★★★★★
3.48 Rating (148 Votes )
There are 3 Steps involved in it
Step: 1
a D Divide the number of infected patients by the total number ...
Get Instant Access to Expert-Tailored Solutions
See step-by-step solutions with expert insights and AI powered tools for academic success
Step: 2

Step: 3
Ace Your Homework with AI
Get the answers you need in no time with our AI-driven, step-by-step assistance
Get Started
Probability & Statistics For Engineers & Scientists
Authors: Ronald E. Walpole, Raymond H. Myers, Sharon L. Myers, Keying
7th Edition
9789813131279, 130415294, 9813131276, 978-0130415295