Question
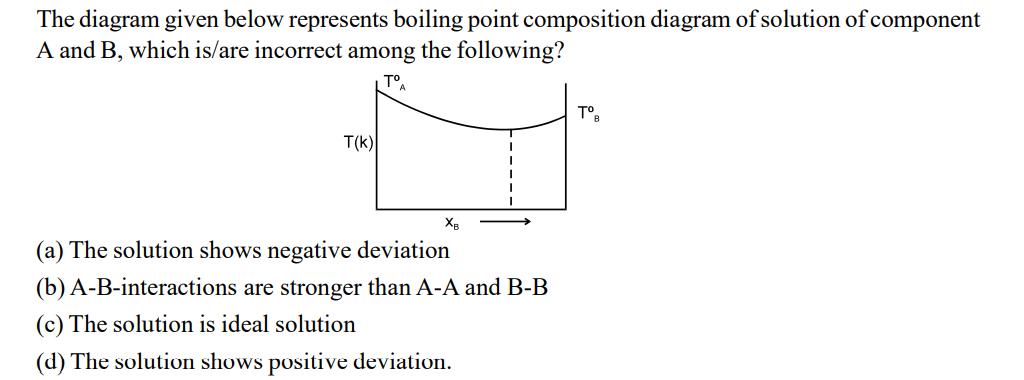
The diagram given below represents boiling point composition diagram of solution of component A and B, which is/are incorrect among the following? TA T(K)

The diagram given below represents boiling point composition diagram of solution of component A and B, which is/are incorrect among the following? TA T(K) XB (a) The solution shows negative deviation (b) A-B-interactions are stronger than A-A and B-B (c) The solution is ideal solution (d) The solution shows positive deviation. TB
Step by Step Solution
3.46 Rating (169 Votes )
There are 3 Steps involved in it
Step: 1

Get Instant Access to Expert-Tailored Solutions
See step-by-step solutions with expert insights and AI powered tools for academic success
Step: 2

Step: 3

Ace Your Homework with AI
Get the answers you need in no time with our AI-driven, step-by-step assistance
Get StartedRecommended Textbook for
Analysis for Financial Management
Authors: Robert Higgins
11th edition
77861787, 978-0077861780
Students also viewed these Chemistry questions
Question
Answered: 1 week ago
Question
Answered: 1 week ago
Question
Answered: 1 week ago
Question
Answered: 1 week ago
Question
Answered: 1 week ago
Question
Answered: 1 week ago
Question
Answered: 1 week ago
Question
Answered: 1 week ago
Question
Answered: 1 week ago
Question
Answered: 1 week ago
Question
Answered: 1 week ago
Question
Answered: 1 week ago
Question
Answered: 1 week ago
Question
Answered: 1 week ago
Question
Answered: 1 week ago
Question
Answered: 1 week ago
Question
Answered: 1 week ago
Question
Answered: 1 week ago
Question
Answered: 1 week ago
Question
Answered: 1 week ago
Question
Answered: 1 week ago
Question
Answered: 1 week ago
View Answer in SolutionInn App


