Answered step by step
Verified Expert Solution
Link Copied!

Question

1 Approved Answer

The difference between sales dollars and total costs after breakeven point on a CVP graph is the representation of :s Question Help The difference between

The difference between sales dollars and total costs after breakeven point on a CVP graph is the representation of
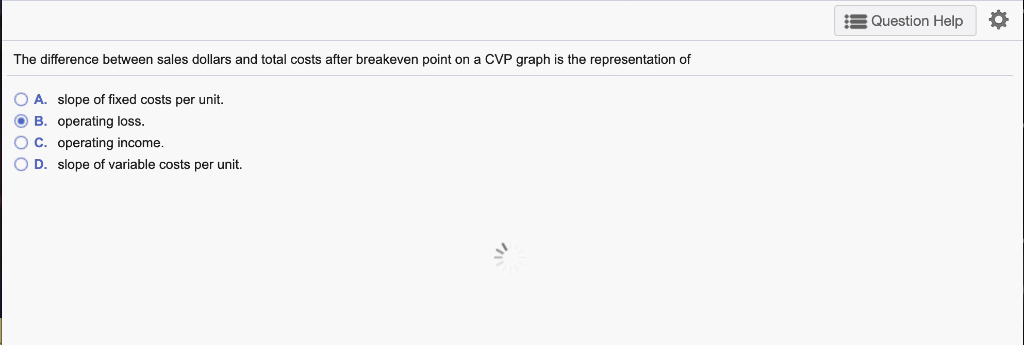
image text in transcribed

:s Question Help The difference between sales dollars and total costs after breakeven point on a CVP graph is the representation of OA. slope of fixed costs per unit. OB. operating loss. O C. operating income. O D . slope of variable costs per unit

Step by Step Solution

There are 3 Steps involved in it

Step: 1

blur-text-image

Get Instant Access to Expert-Tailored Solutions

See step-by-step solutions with expert insights and AI powered tools for academic success

Step: 2

blur-text-image

Step: 3

blur-text-image

Ace Your Homework with AI

Get the answers you need in no time with our AI-driven, step-by-step assistance

Get Started

Recommended Textbook for

Management Reporting Und Behavioral Accounting Verhaltenswirkungen Des Berichtswesens Im Unternehmen

Authors: Andreas Taschner

2nd., 2nd. Auflage Aufl. 2019 Edition

3658234911, 978-3658234911

More Books

Students also viewed these Accounting questions

Question

How might bad weather be good for farmers?

Answered: 1 week ago

Question

2. Define identity.

Answered: 1 week ago

Question

1. Identify three communication approaches to identity.

Answered: 1 week ago

Question

4. Describe phases of majority identity development.

Answered: 1 week ago