Answered step by step
Verified Expert Solution
Question
1 Approved Answer
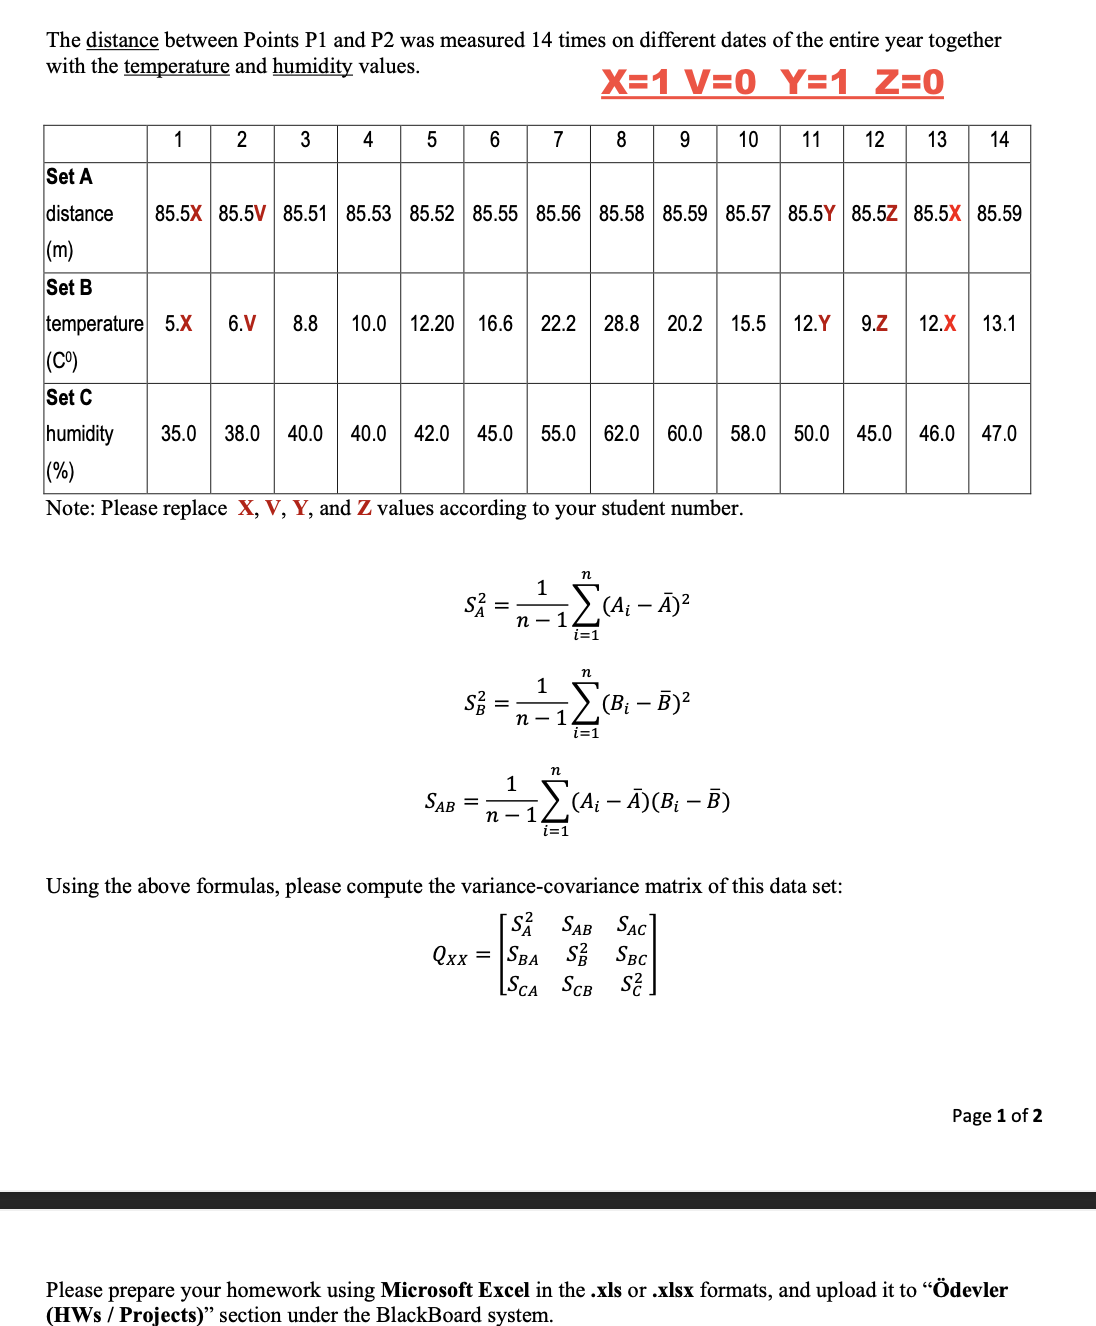
The distance between Points P1 and P2 was measured 14 times on different dates of the entire year together with the temperature and humidity

The distance between Points P1 and P2 was measured 14 times on different dates of the entire year together with the temperature and humidity values. X=1 V=0 Y=1 Z=0 89 10 Set A distance 1 2 3 4 5 6 SAB 85.5X 85.5V 85.51 85.53 85.52 85.55 85.56 85.58 85.59 85.57 85.5Y 85.5Z 85.5X 85.59 (m) Set B temperature 5.X 6.V 8.8 10.0 12.20 16.6 22.2 28.8 20.2 15.5 12.Y 9.Z 12.X 13.1 (Co) Set C humidity 35.0 38.0 40.0 40.0 42.0 45.0 55.0 62.0 60.0 58.0 (%) Note: Please replace X, V, Y, and Z values according to your student number. 7 SA (A ) S: n 1 1 1 n - 1 n n i=1 i=1 n (B-B) 11 12 13 14 i=1 1 in-1 (A-A) (B - B) 50.0 Using the above formulas, please compute the variance-covariance matrix of this data set: SA SAB SAC Qxx = SBA S SBC SCA SCB S. 45.0 46.0 47.0 Page 1 of 2 Please prepare your homework using Microsoft Excel in the .xls or .xlsx formats, and upload it to "devler (HWS / Projects)" section under the BlackBoard system.
Step by Step Solution
There are 3 Steps involved in it
Step: 1

Get Instant Access to Expert-Tailored Solutions
See step-by-step solutions with expert insights and AI powered tools for academic success
Step: 2

Step: 3

Ace Your Homework with AI
Get the answers you need in no time with our AI-driven, step-by-step assistance
Get Started


