

Answered step by step
Verified Expert Solution
Question
1 Approved Answer
The dropdown box is asking whether its decreasing or increasing. The table lists the annual cost (in dollars) of tuition and fees at private four-year
The dropdown box is asking whether its decreasing or increasing.
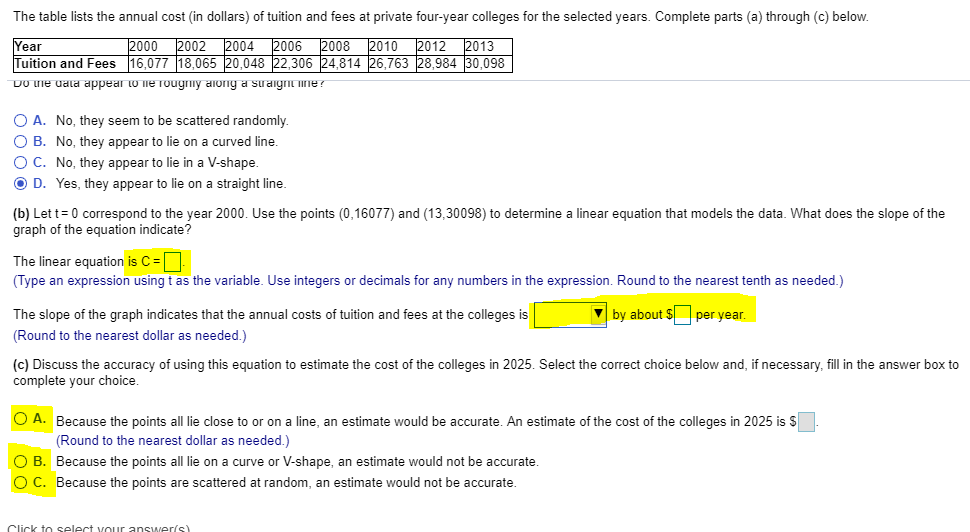
The table lists the annual cost (in dollars) of tuition and fees at private four-year colleges for the selected years. Complete parts (a) through (c) below 2000 2002200420062008 201020122013 ear Tuition and Fees 16,077 18,065 20,048 22,306 24,814 26,763 28,984 30,098 ( A. No, they seem to be scattered randomly B. No, they appear to lie on a curved line. O C. No, they appear to lie in a V-shape. O D. Yes, they appear to lie on a straight line (b) Let t-0 correspond to the year 2000. Use the points(0,16077) and (13,30098) to determine a linear equation that models the data. What does the slope of the graph of the equation indicate? The linear equation is C Type an expression using t as the variable. Use integers or decimals for any numbers in the expression. Round to the nearest tenth as needed) by about Sper yea. The slope of the graph indicates that the annual costs of tuition and fees at the colleges is Round to the nearest dollar as needed.) (c) Discuss the accuracy of using this equation to estimate the cost of the colleges in 2025. Select the correct choice below and, if necessary, fill in the answer box to complete your choice. A. Because the points all lie close to or on a line, an estimate would be accurate. An estimate of the cost of the colleges in 2025 is $ (Round to the nearest dollar as needed.) B. Because the points all lie on a curve or V-shape, an estimate would not be accurate. C. Because the points are scattered at random, an estimate would not be accurate. The table lists the annual cost (in dollars) of tuition and fees at private four-year colleges for the selected years. Complete parts (a) through (c) below 2000 2002200420062008 201020122013 ear Tuition and Fees 16,077 18,065 20,048 22,306 24,814 26,763 28,984 30,098 ( A. No, they seem to be scattered randomly B. No, they appear to lie on a curved line. O C. No, they appear to lie in a V-shape. O D. Yes, they appear to lie on a straight line (b) Let t-0 correspond to the year 2000. Use the points(0,16077) and (13,30098) to determine a linear equation that models the data. What does the slope of the graph of the equation indicate? The linear equation is C Type an expression using t as the variable. Use integers or decimals for any numbers in the expression. Round to the nearest tenth as needed) by about Sper yea. The slope of the graph indicates that the annual costs of tuition and fees at the colleges is Round to the nearest dollar as needed.) (c) Discuss the accuracy of using this equation to estimate the cost of the colleges in 2025. Select the correct choice below and, if necessary, fill in the answer box to complete your choice. A. Because the points all lie close to or on a line, an estimate would be accurate. An estimate of the cost of the colleges in 2025 is $ (Round to the nearest dollar as needed.) B. Because the points all lie on a curve or V-shape, an estimate would not be accurate. C. Because the points are scattered at random, an estimate would not be accurateStep by Step Solution
There are 3 Steps involved in it
Step: 1

Get Instant Access to Expert-Tailored Solutions
See step-by-step solutions with expert insights and AI powered tools for academic success
Step: 2

Step: 3
Ace Your Homework with AI
Get the answers you need in no time with our AI-driven, step-by-step assistance
Get Started
Weathering The Storm The Financial Crisis And The EU Response Background And Origins Of The Crisis Volume I
Authors: Javier Villar Burke
1st Edition
1631576194,1631576208