Question
The Econometrics Society organizes the 24th Annual Regression Contest in 2022 among participants who recently passed the Econ301 courses. A team in the organization committee
The Econometrics Society organizes the 24th Annual Regression Contest in 2022 among participants who recently passed the Econ301 courses. A team in the organization committee simulate 1000 observations (Y and X pairs) for the individuals based on the following data generating process (DGP)
Yi = β0 + β1Xi + εi
where β0 = 1.03, β1 = 0.83 and ε ∼ N(0, σ2 ) that are exclusively known by the organization committee but hidden from the contestants. In the first qualifying stage, the aim is to estimate the slope of the regression line for a given sub-sample data and provide a decision on whether the true slope parameter is equal to 1. The organization committee delivers the randomly drawn data for subsets (100 observations) of the original data set to each contestants and expects them to come up with the decision.
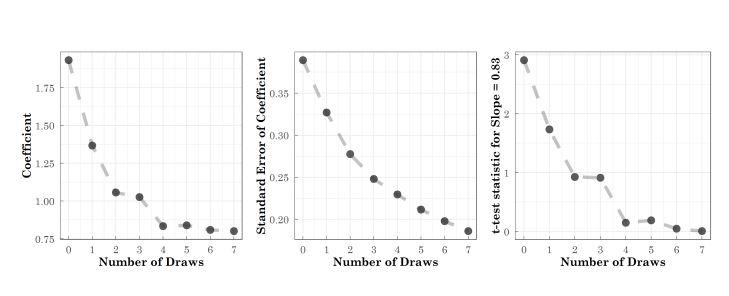
The second stage of the contest is more tricky for the participants. Now, the committee announces that the population parameter for the slope is β1 = 0.83. In this stage, participants keep holding their first samples in hand and are allowed to draw more observation from the population to increase their sample size by 100 by request. For example, the first draw increase the number of observation to 200; if you draw twice, then you end up with 300 observations and so on. The aim is to make a decision on the optimal (least possible) number of additional draws to be able to estimate a slope parameter which is statistically equal to 0.83 at 90% confidence level (1.645 is the critical value for a confidence level of 90%). Each request comes with a cost, the participants with optimal (least possible) number of draws overtake and get a prize.
a) Suppose that you are given the plot below after the contest which shows the possible path of regression outcomes (coefficient, standard error and t-stats) after each draw. What was the optimal number of draws you should have chosen to win the contest?

b) Discuss the convergence of coefficient and standard errors to specific values in the first two panels of the plot above using statistical theory.
Coefficient 1.75 A 1.50 1.25 1.00 0.75 0 1 1 Number of Draws 6 7 Standard Error of Coefficient 0.30 0.25 0,20 0 1 Number of Draws 6 02 t-test statistic for Slope = 0.83 0 Number of Draws 6 7
Step by Step Solution
3.43 Rating (150 Votes )
There are 3 Steps involved in it
Step: 1

Get Instant Access to Expert-Tailored Solutions
See step-by-step solutions with expert insights and AI powered tools for academic success
Step: 2

Step: 3

Ace Your Homework with AI
Get the answers you need in no time with our AI-driven, step-by-step assistance
Get Started


