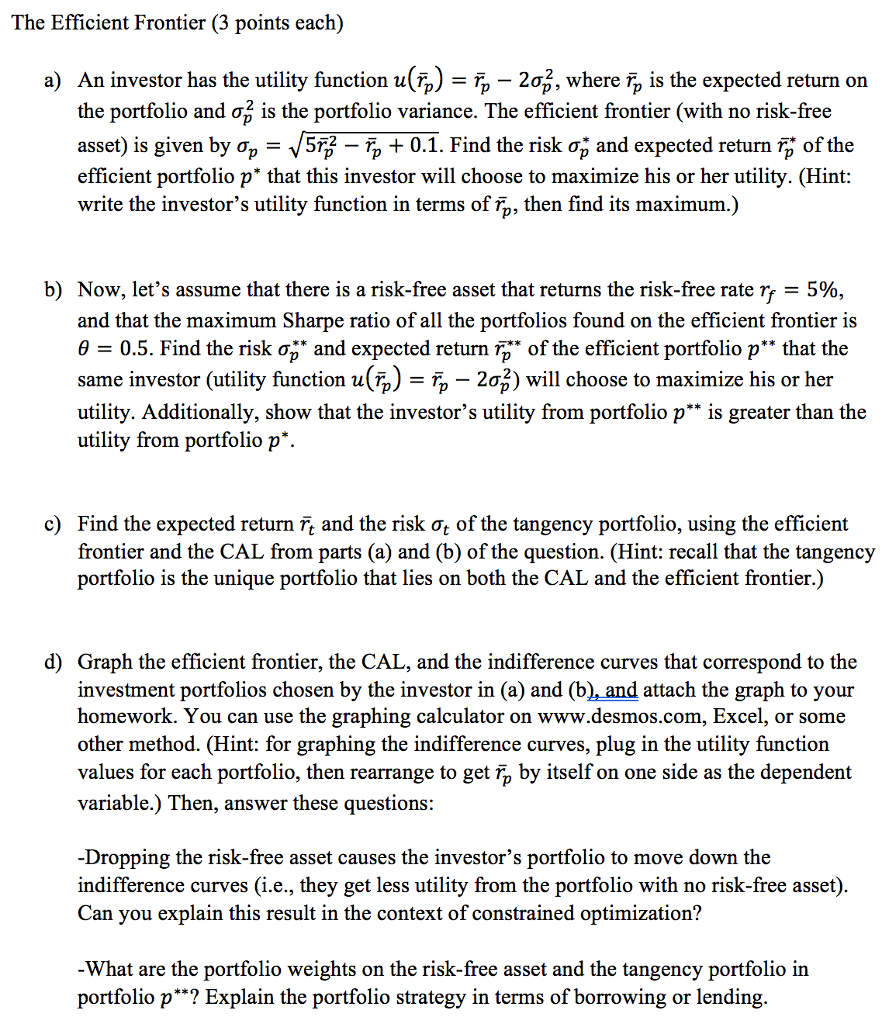
The Efficient Frontier (3 points each) An investor has the utility function u(b)-b-2;, where the portfolio and , is the portfolio variance. The efficient frontier (with no risk-free asset) is given by p 513-7, + 0.1. Find the risk and expected return of the efficient portfolio p* that this investor will choose to maximize his or her utility. (Hint: write the investor's utility function in terms of rp, then find its maximum.) a) is the expected return on b) Now, let's assume that there is a risk-free asset that returns the risk-free rate r, = 5% and that the maximum Sharpe ratio of all the portfolios found on the efficient frontier is -0.5. Find the risk * and expected return rp.* of the efficient portfolio p** that the same investor (utility function u(Tp) Tp-2 will choose to maximize his or her utility. Additionally, show that the investor's utility from portfolio p** is greater than the utility from portfolio p*. c) Find the expected return and the risk of the tangency portfolio, using the efficient frontier and the CAL from parts (a) and (b) of the question. (Hint: recall that the tangency portfolio is the unique portfolio that lies on both the CAL and the efficient frontier.) d) Graph the efficient frontier, the CAL, and the indifference curves that correspond to the investment portfolios chosen by the investor in (a) and (b), and attach the graph to your homework. You can use the graphing calculator on www.desmos.com, Excel, or some other method. (Hint: for graphing the indifference curves, plug in the utility function values for each portfolio, then rearrange to get by itself on one side as the dependent variable.) Then, answer these questions: -Dropping the risk-free asset causes the investor's portfolio to move down the indifference curves (i.e., they get less utility from the portfolio with no risk-free asset) Can you explain this result in the context of constrained optimization? What are the portfolio weights on the risk-free asset and the tangency portfolio in portfolio p**? Explain the portfolio strategy in terms of borrowing or lending The Efficient Frontier (3 points each) An investor has the utility function u(b)-b-2;, where the portfolio and , is the portfolio variance. The efficient frontier (with no risk-free asset) is given by p 513-7, + 0.1. Find the risk and expected return of the efficient portfolio p* that this investor will choose to maximize his or her utility. (Hint: write the investor's utility function in terms of rp, then find its maximum.) a) is the expected return on b) Now, let's assume that there is a risk-free asset that returns the risk-free rate r, = 5% and that the maximum Sharpe ratio of all the portfolios found on the efficient frontier is -0.5. Find the risk * and expected return rp.* of the efficient portfolio p** that the same investor (utility function u(Tp) Tp-2 will choose to maximize his or her utility. Additionally, show that the investor's utility from portfolio p** is greater than the utility from portfolio p*. c) Find the expected return and the risk of the tangency portfolio, using the efficient frontier and the CAL from parts (a) and (b) of the question. (Hint: recall that the tangency portfolio is the unique portfolio that lies on both the CAL and the efficient frontier.) d) Graph the efficient frontier, the CAL, and the indifference curves that correspond to the investment portfolios chosen by the investor in (a) and (b), and attach the graph to your homework. You can use the graphing calculator on www.desmos.com, Excel, or some other method. (Hint: for graphing the indifference curves, plug in the utility function values for each portfolio, then rearrange to get by itself on one side as the dependent variable.) Then, answer these questions: -Dropping the risk-free asset causes the investor's portfolio to move down the indifference curves (i.e., they get less utility from the portfolio with no risk-free asset) Can you explain this result in the context of constrained optimization? What are the portfolio weights on the risk-free asset and the tangency portfolio in portfolio p**? Explain the portfolio strategy in terms of borrowing or lending