Answered step by step
Verified Expert Solution
Question
1 Approved Answer
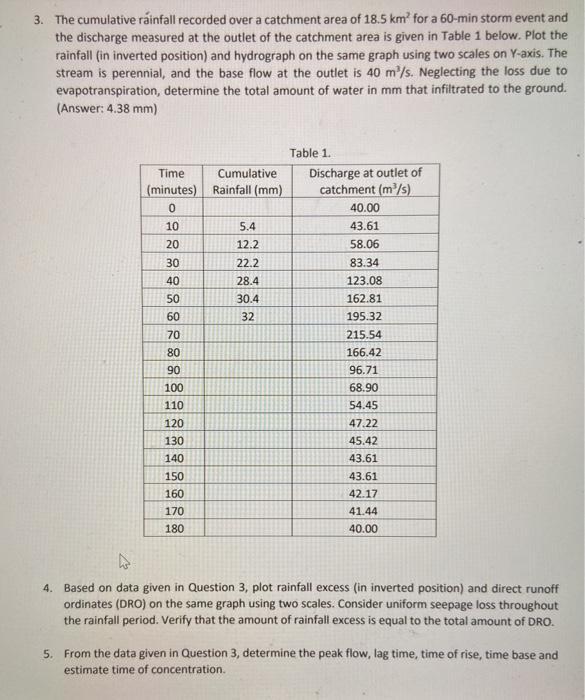
3. The cumulative rainfall recorded over a catchment area of 18.5 km for a 60-min storm event and the discharge measured at the outlet

3. The cumulative rainfall recorded over a catchment area of 18.5 km for a 60-min storm event and the discharge measured at the outlet of the catchment area is given in Table 1 below. Plot the rainfall (in inverted position) and hydrograph on the same graph using two scales on Y-axis. The stream is perennial, and the base flow at the outlet is 40 m/s. Neglecting the loss due to evapotranspiration, determine the total amount of water in mm that infiltrated to the ground. (Answer: 4.38 mm) Cumulative Time (minutes) Rainfall (mm) 0 10 20 30 40 50 60 70 80 90 100 110 120 130 140 150 160 170 180 5.4 12.2 22.2 28.4 30.4 32 Table 1. Discharge at outlet of catchment (m/s) 40.00 43.61 58.06 83.34 123.08 162.81 195.32 215.54 166.42 96.71 68.90 54.45 47.22 45.42 43.61 43.61 42.17 41.44 40.00 4. Based on data given in Question 3, plot rainfall excess (in inverted position) and direct runoff ordinates (DRO) on the same graph using two scales. Consider uniform seepage loss throughout the rainfall period. Verify that the amount of rainfall excess is equal to the total amount of DRO. 5. From the data given in Question 3, determine the peak flow, lag time, time of rise, time base and estimate time of concentration.
Step by Step Solution
★★★★★
3.46 Rating (166 Votes )
There are 3 Steps involved in it
Step: 1
Ans...
Get Instant Access to Expert-Tailored Solutions
See step-by-step solutions with expert insights and AI powered tools for academic success
Step: 2

Step: 3

Ace Your Homework with AI
Get the answers you need in no time with our AI-driven, step-by-step assistance
Get Started


