

Answered step by step
Verified Expert Solution
Question
1 Approved Answer
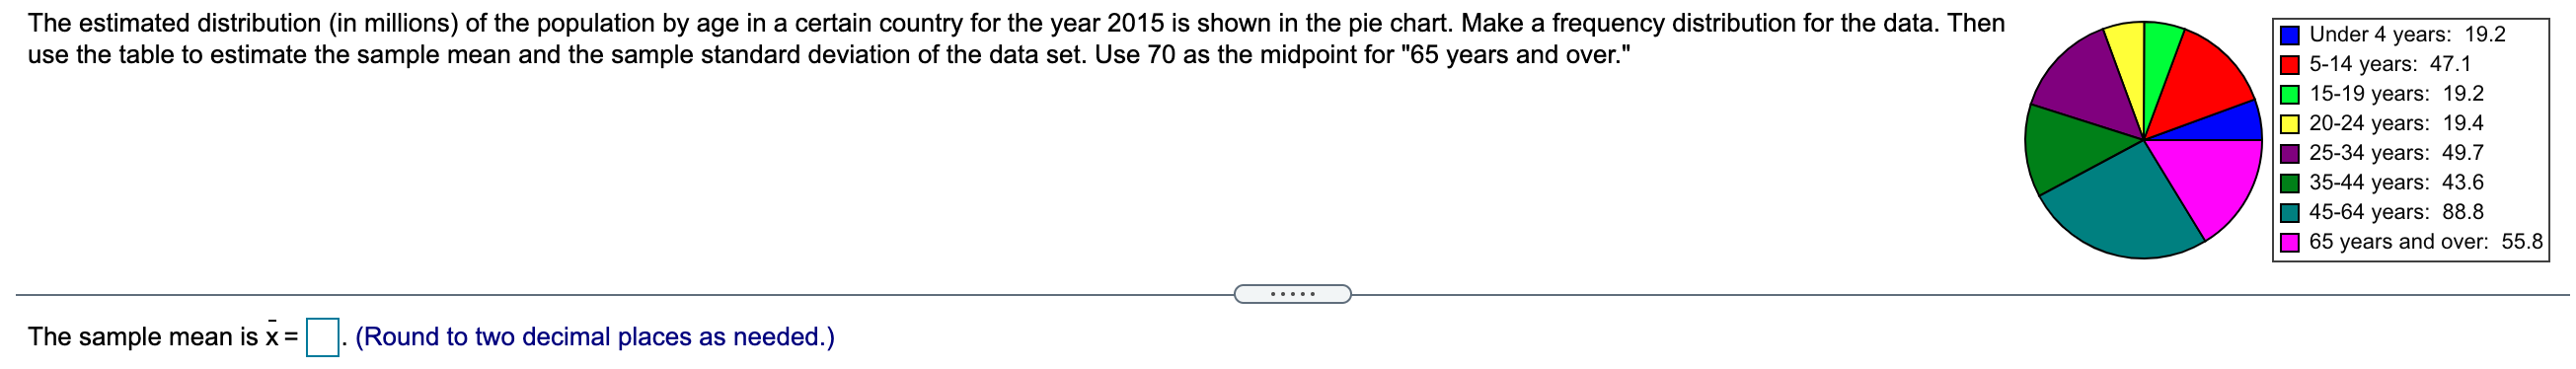
The estimated distribution (in millions) of the population by age in a certain country for the year 2015 is shown in the pie chart. Make
Step by Step Solution
There are 3 Steps involved in it
Step: 1

Get Instant Access to Expert-Tailored Solutions
See step-by-step solutions with expert insights and AI powered tools for academic success
Step: 2

Step: 3
Ace Your Homework with AI
Get the answers you need in no time with our AI-driven, step-by-step assistance
Get Started
Nonlinear Systems And Their Remarkable Mathematical Structures Volume 3, Contributions From China
Authors: Norbert Euler, Da jun Zhang
1st Edition
1000423301, 9781000423303