

Question: The Excel file sample contains 100 observations, X, drawn from a distribution that is n(,1). Use Excel and your own computations to calculate: P(24.9
The Excel file sample contains 100 observations, X, drawn from a distribution that is n(μ,1). Use Excel and your own computations to calculate:
• P(24.9 ≤ μ ≤ 25.1) based only on observations 1 through 50; and
• P(24.9 ≤ μ ≤ 25.1) based on all 100 observations.
You can use Excel to compute the sample means based on the above three samples.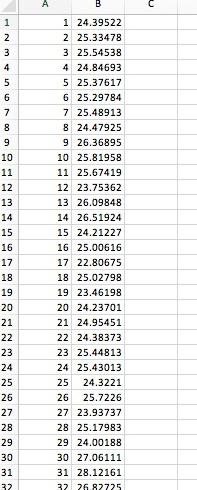
1 N34567 2 8 9 10 11 12 13 14 15 16 17 18 19 20 21 22 23 24 25 26 27 28 29 30 31 32 A B 1 24.39522 2 25.33478 3 25.54538 4 24.84693 5 25.37617 6 25.29784 7 25.48913 8 24.47925 9 26.36895 10 25.81958 11 25.67419 12 23.75362 13 26.09848 14 26.51924 15 24.21227 16 25.00616 17 22.80675 18 25.02798 19 23.46198 20 24.23701 21 24.95451 22 24.38373 23 25.44813 24 25.43013 25 24.3221 26 25.7226 27 23.93737 28 25.17983 29 24.00188 30 27.06111 31 28.12161 32 26.82725 U
Step by Step Solution
3.54 Rating (161 Votes )
There are 3 Steps involved in it

Get step-by-step solutions from verified subject matter experts