Answered step by step
Verified Expert Solution
Link Copied!

Question

1 Approved Answer

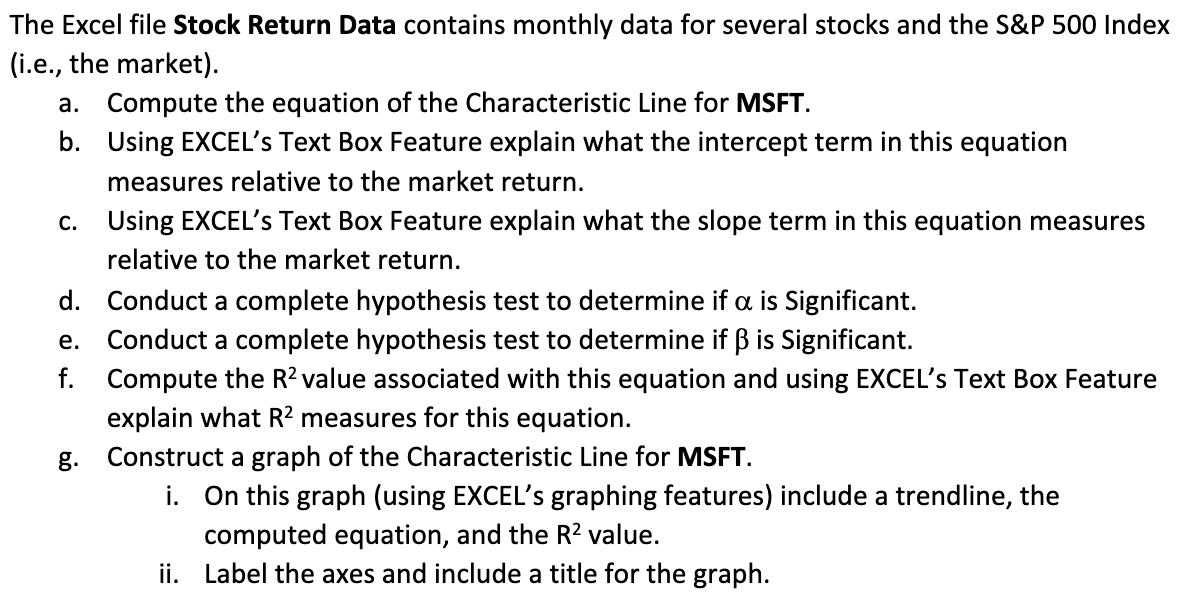
The Excel file Stock Return Data contains monthly data for several stocks and the S&P 500 Index (i.e., the market). a. Compute the equation of

image text in transcribed

The Excel file Stock Return Data contains monthly data for several stocks and the S\&P 500 Index (i.e., the market). a. Compute the equation of the Characteristic Line for MSFT. b. Using EXCEL's Text Box Feature explain what the intercept term in this equation measures relative to the market return. c. Using EXCEL's Text Box Feature explain what the slope term in this equation measures relative to the market return. d. Conduct a complete hypothesis test to determine if is Significant. e. Conduct a complete hypothesis test to determine if is Significant. f. Compute the R2 value associated with this equation and using EXCEL's Text Box Feature explain what R2 measures for this equation. g. Construct a graph of the Characteristic Line for MSFT. i. On this graph (using EXCEL's graphing features) include a trendline, the computed equation, and the R2 value. ii. Label the axes and include a title for the graph. The Excel file Stock Return Data contains monthly data for several stocks and the S\&P 500 Index (i.e., the market). a. Compute the equation of the Characteristic Line for MSFT. b. Using EXCEL's Text Box Feature explain what the intercept term in this equation measures relative to the market return. c. Using EXCEL's Text Box Feature explain what the slope term in this equation measures relative to the market return. d. Conduct a complete hypothesis test to determine if is Significant. e. Conduct a complete hypothesis test to determine if is Significant. f. Compute the R2 value associated with this equation and using EXCEL's Text Box Feature explain what R2 measures for this equation. g. Construct a graph of the Characteristic Line for MSFT. i. On this graph (using EXCEL's graphing features) include a trendline, the computed equation, and the R2 value. ii. Label the axes and include a title for the graph

Step by Step Solution

There are 3 Steps involved in it

Step: 1

blur-text-image

Get Instant Access to Expert-Tailored Solutions

See step-by-step solutions with expert insights and AI powered tools for academic success

Step: 2

blur-text-image

Step: 3

blur-text-image

Ace Your Homework with AI

Get the answers you need in no time with our AI-driven, step-by-step assistance

Get Started

Recommended Textbook for

Optimization Methods In Finance

Authors: Gerard Cornuejols, Reha Tütüncü

1st Edition

0521861705, 978-0521861700

More Books

Students also viewed these Finance questions

Question

List some of the features that characterize Eurocurrency loans.

Answered: 1 week ago

Question

When is it appropriate to use a root cause analysis

Answered: 1 week ago