Question
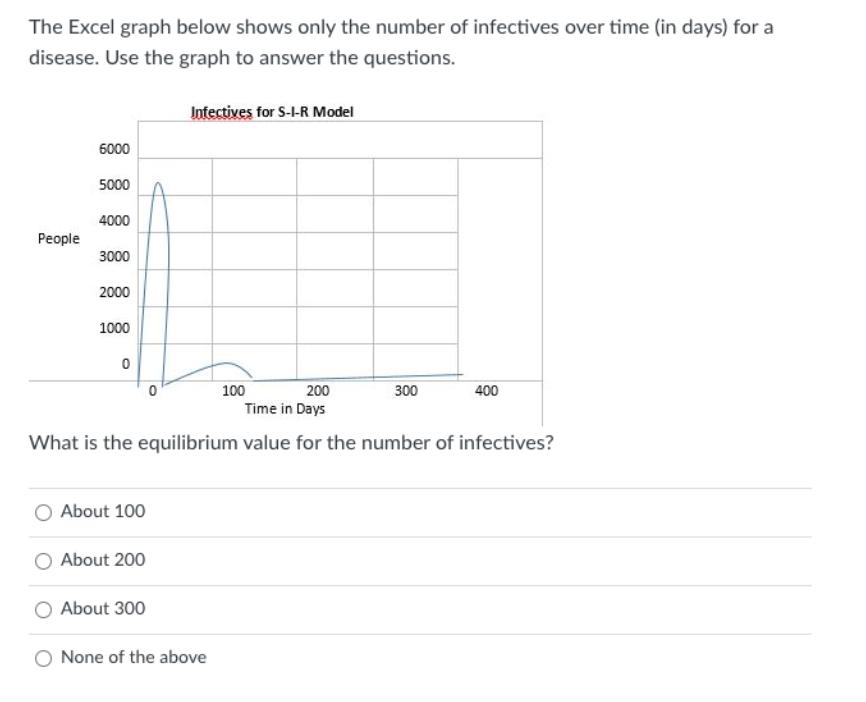
The Excel graph below shows only the number of infectives over time (in days) for a disease. Use the graph to answer the questions.

The Excel graph below shows only the number of infectives over time (in days) for a disease. Use the graph to answer the questions. Infectives for S--R Model 6000 5000 4000 People 3000 2000 1000 200 Time in Days 100 300 400 What is the equilibrium value for the number of infectives? About 100 About 200 About 300 None of the above
Step by Step Solution
3.40 Rating (172 Votes )
There are 3 Steps involved in it
Step: 1
The equilibrium value will be the Ypeople value for which after a very ...
Get Instant Access to Expert-Tailored Solutions
See step-by-step solutions with expert insights and AI powered tools for academic success
Step: 2

Step: 3

Ace Your Homework with AI
Get the answers you need in no time with our AI-driven, step-by-step assistance
Get StartedRecommended Textbook for
Principles of Macroeconomics
Authors: Karl E. Case, Ray C. Fair, Sharon E. Oster
12th edition
134078802, 978-0134078809
Students also viewed these Mathematics questions
Question
Answered: 1 week ago
Question
Answered: 1 week ago
Question
Answered: 1 week ago
Question
Answered: 1 week ago
Question
Answered: 1 week ago
Question
Answered: 1 week ago
Question
Answered: 1 week ago
Question
Answered: 1 week ago
Question
Answered: 1 week ago
Question
Answered: 1 week ago
Question
Answered: 1 week ago
Question
Answered: 1 week ago
Question
Answered: 1 week ago
Question
Answered: 1 week ago
Question
Answered: 1 week ago
Question
Answered: 1 week ago
Question
Answered: 1 week ago
Question
Answered: 1 week ago
Question
Answered: 1 week ago
Question
Answered: 1 week ago
View Answer in SolutionInn App


