Answered step by step
Verified Expert Solution
Question
1 Approved Answer
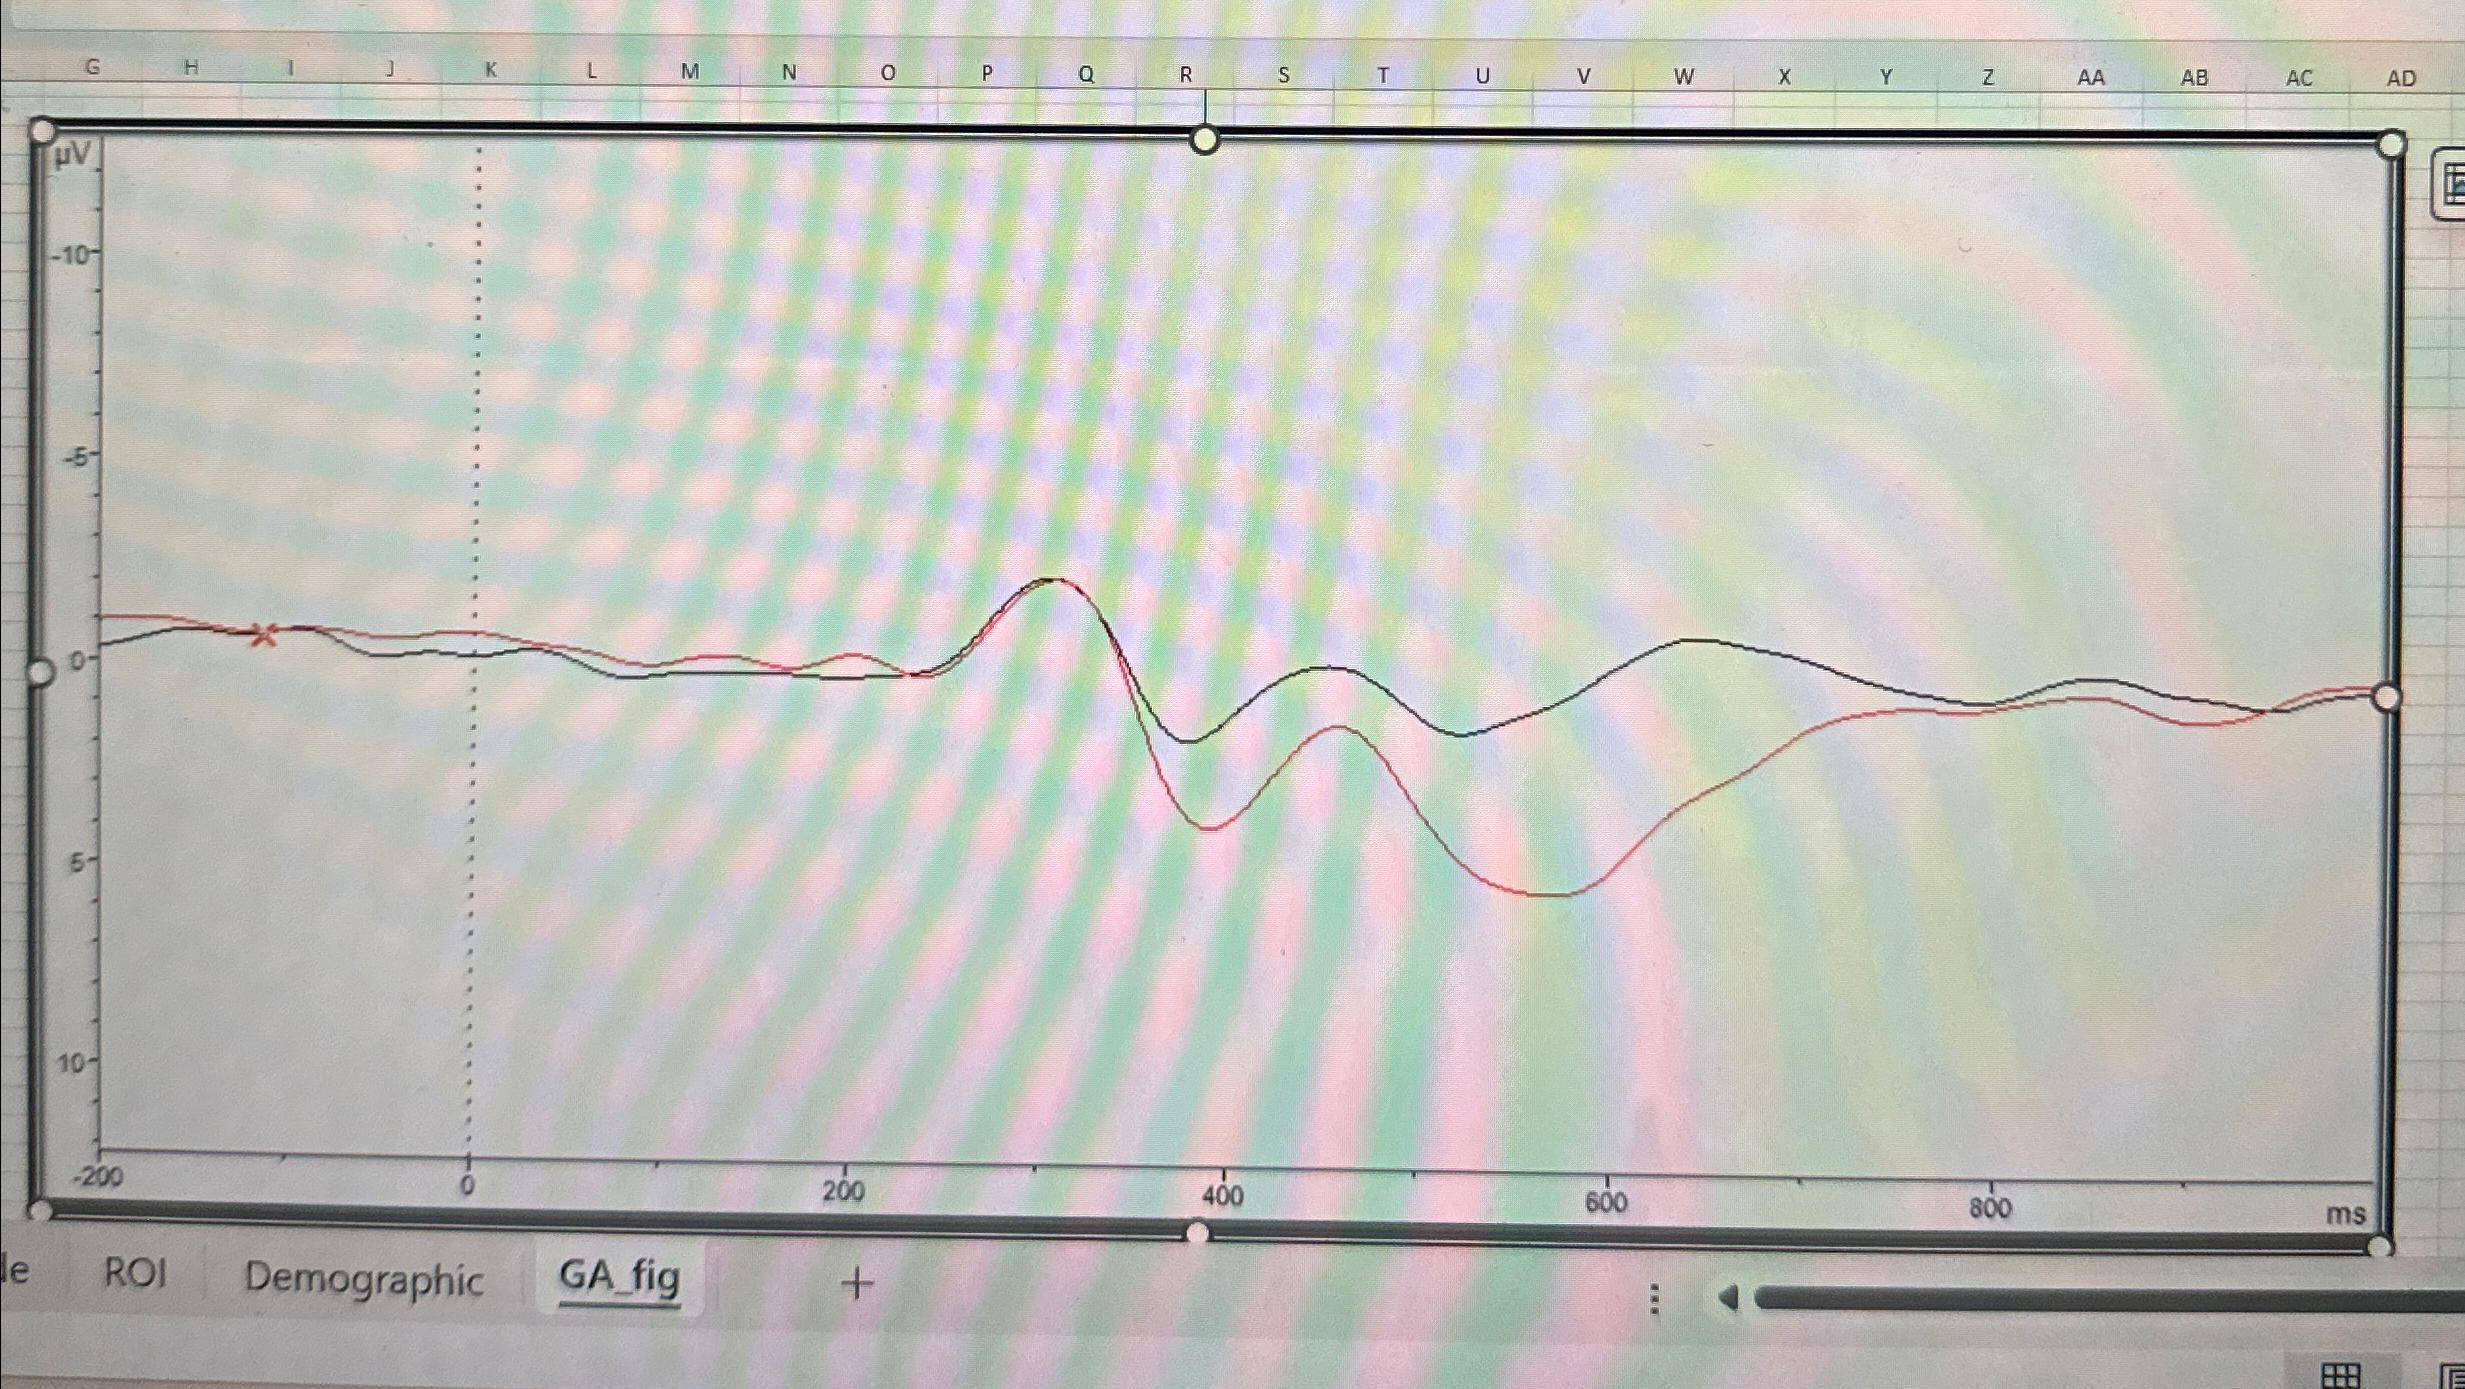
The experiment included target ( squares ) and non target ( circles ) stimuli flashing on the screen and participants were asked to count the
The experiment included target squares and non target circles stimuli flashing on the screen and participants were asked to count the number of squares. Explain what should be seen in the ERPs. Provided is a graph showing the grand averages with black and red lines. Indicate which is target and non target stimuli and base the analysis off the P Describe in detail this process and if it met the expected outcome. Also identify graph titles and axis titles.

Step by Step Solution
There are 3 Steps involved in it
Step: 1

Get Instant Access to Expert-Tailored Solutions
See step-by-step solutions with expert insights and AI powered tools for academic success
Step: 2

Step: 3

Ace Your Homework with AI
Get the answers you need in no time with our AI-driven, step-by-step assistance
Get Started


