Answered step by step
Verified Expert Solution
Link Copied!

Question

1 Approved Answer

The figure below exhibits the historical trade-off between risk and return in various portfolios. ACCORDING TO THIS FIGURE, which of the following statements is TRUE?
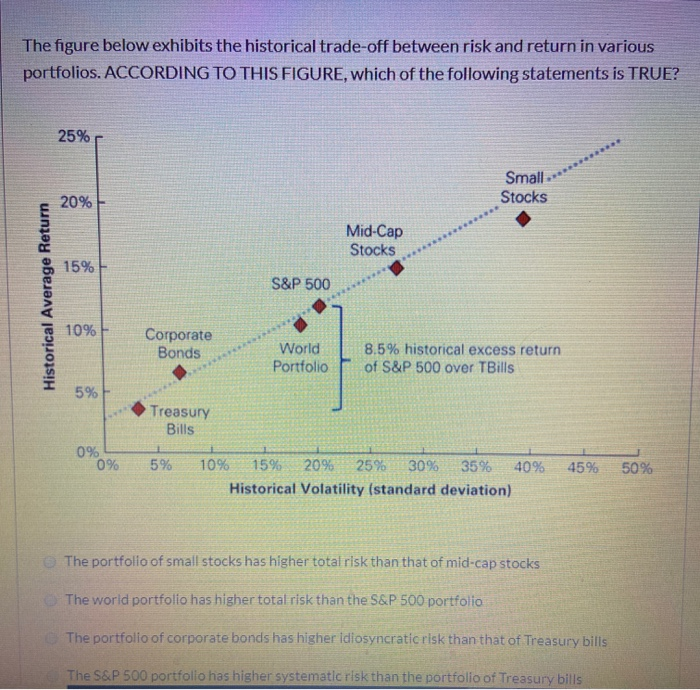
image text in transcribed
The figure below exhibits the historical trade-off between risk and return in various portfolios. ACCORDING TO THIS FIGURE, which of the following statements is TRUE? 25% Small Stocks 20% Mid-Cap Stocks 15% S&P 500 Historical Average Return 10% Corporate Bonds World Portfolio 8.5% historical excess return of S&P 500 over TBills Treasury Bills 0% 0% 5% 45% 50% 10% 15% 20% 25% 30% 35% 40% Historical Volatility (standard deviation) The portfolio of small stocks has higher total risk than that of mid-cap stocks The world portfolio has higher total risk than the S&P 500 portfolio The portfolio of corporate bonds has higher idiosyncratic risk than that of Treasury bills! The S&P 500 portfolio has higher systematic risk than the portfolio of Treasury bills

Step by Step Solution

There are 3 Steps involved in it

Step: 1

blur-text-image

Get Instant Access to Expert-Tailored Solutions

See step-by-step solutions with expert insights and AI powered tools for academic success

Step: 2

blur-text-image_2

Step: 3

blur-text-image_3

Ace Your Homework with AI

Get the answers you need in no time with our AI-driven, step-by-step assistance

Get Started

Recommended Textbook for

Founding Finance How Debt Speculation Foreclosures Protests And Crackdowns Made Us A Nation

Authors: William Hogeland

1st Edition

0292757530, 978-0292757530

More Books

Students also viewed these Finance questions