Question
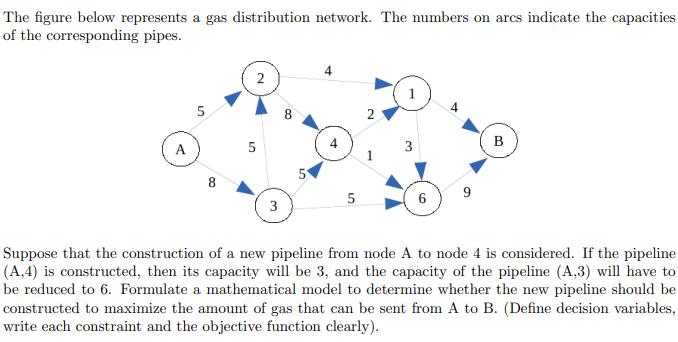
The figure below represents a gas distribution network. The numbers on arcs indicate the capacities of the corresponding pipes. A 5 8 2 5

The figure below represents a gas distribution network. The numbers on arcs indicate the capacities of the corresponding pipes. A 5 8 2 5 3 8 5 5 2 3 6 B Suppose that the construction of a new pipeline from node A to node 4 is considered. If the pipeline (A,4) is constructed, then its capacity will be 3, and the capacity of the pipeline (A,3) will have to be reduced to 6. Formulate a mathematical model to determine whether the new pipeline should be constructed to maximize the amount of gas that can be sent from A to B. (Define decision variables, write each constraint and the objective function clearly).
Step by Step Solution
3.38 Rating (170 Votes )
There are 3 Steps involved in it
Step: 1

Get Instant Access to Expert-Tailored Solutions
See step-by-step solutions with expert insights and AI powered tools for academic success
Step: 2

Step: 3

Ace Your Homework with AI
Get the answers you need in no time with our AI-driven, step-by-step assistance
Get StartedRecommended Textbook for
Chemical Principles
Authors: Steven S. Zumdahl, Donald J. DeCoste
7th edition
9781133109235, 1111580650, 978-1111580650
Students also viewed these Mathematics questions
Question
Answered: 1 week ago
Question
Answered: 1 week ago
Question
Answered: 1 week ago
Question
Answered: 1 week ago
Question
Answered: 1 week ago
Question
Answered: 1 week ago
Question
Answered: 1 week ago
Question
Answered: 1 week ago
Question
Answered: 1 week ago
Question
Answered: 1 week ago
Question
Answered: 1 week ago
Question
Answered: 1 week ago
Question
Answered: 1 week ago
Question
Answered: 1 week ago
Question
Answered: 1 week ago
Question
Answered: 1 week ago
Question
Answered: 1 week ago
Question
Answered: 1 week ago
Question
Answered: 1 week ago
Question
Answered: 1 week ago
Question
Answered: 1 week ago
Question
Answered: 1 week ago
View Answer in SolutionInn App


