Question
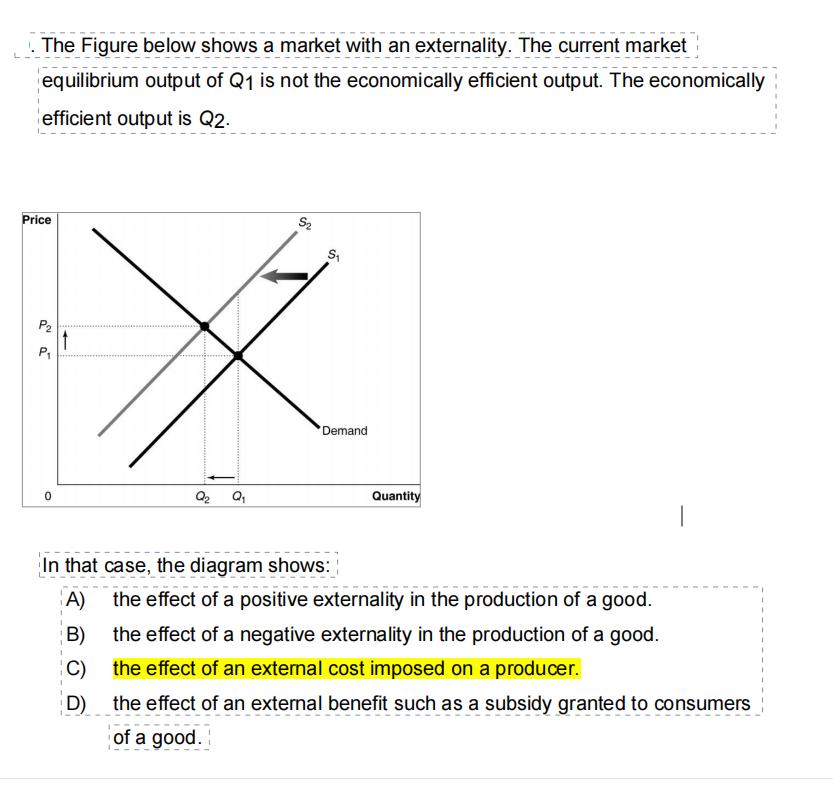
. The Figure below shows a market with an externality. The current market equilibrium output of Q1 is not the economically efficient output. The

. The Figure below shows a market with an externality. The current market equilibrium output of Q1 is not the economically efficient output. The economically efficient output is Q2. Price P P t Q Q 25 S Demand In that case, the diagram shows: In that case, A) B) C) D) Quantity the effect of a positive externality in the production of a good. the effect of a negative externality in the production of a good. the effect of an external cost imposed on a producer. the effect of an external benefit such as a subsidy granted to consumers of a good.
Step by Step Solution
There are 3 Steps involved in it
Step: 1
Answer The diagram shows the effect of a negative externality in the production of a good A...
Get Instant Access to Expert-Tailored Solutions
See step-by-step solutions with expert insights and AI powered tools for academic success
Step: 2

Step: 3

Ace Your Homework with AI
Get the answers you need in no time with our AI-driven, step-by-step assistance
Get StartedRecommended Textbook for
Economics
Authors: R. Glenn Hubbard
6th edition
978-0134797731, 134797736, 978-0134106243
Students also viewed these Economics questions
Question
Answered: 1 week ago
Question
Answered: 1 week ago
Question
Answered: 1 week ago
Question
Answered: 1 week ago
Question
Answered: 1 week ago
Question
Answered: 1 week ago
Question
Answered: 1 week ago
Question
Answered: 1 week ago
Question
Answered: 1 week ago
Question
Answered: 1 week ago
Question
Answered: 1 week ago
Question
Answered: 1 week ago
Question
Answered: 1 week ago
Question
Answered: 1 week ago
Question
Answered: 1 week ago
Question
Answered: 1 week ago
Question
Answered: 1 week ago
Question
Answered: 1 week ago
Question
Answered: 1 week ago
Question
Answered: 1 week ago
Question
Answered: 1 week ago
Question
Answered: 1 week ago
Question
Answered: 1 week ago
Question
Answered: 1 week ago
View Answer in SolutionInn App


