Question
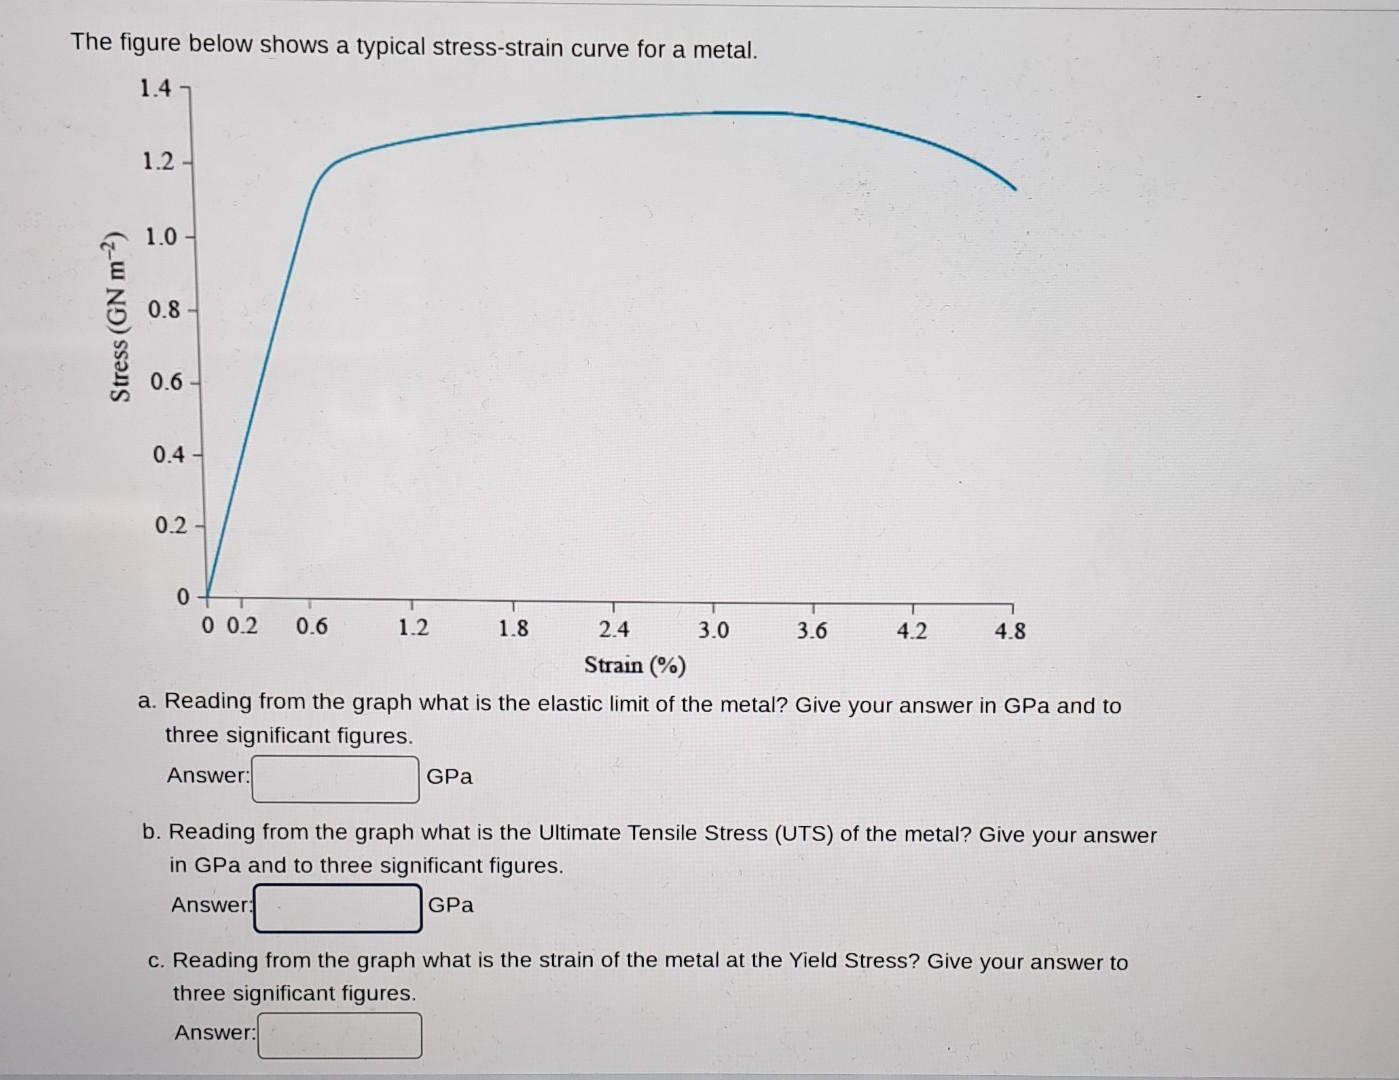
The figure below shows a typical stress-strain curve for a metal. 1.4 1.2 1.0- 0.8 0.6- 0.4 T 0.2- 0+T 0 0.2 0.6 2.4

The figure below shows a typical stress-strain curve for a metal. 1.4 1.2 1.0- 0.8 0.6- 0.4 T 0.2- 0+T 0 0.2 0.6 2.4 Strain (%) a. Reading from the graph what is the elastic limit of the metal? Give your answer in GPa and to three significant figures. Answer: 1.2 GPa 1.8 3.0 3.6 4.2 4.8 b. Reading from the graph what is the Ultimate Tensile Stress (UTS) of the metal? Give your answer in GPa and to three significant figures. Answer: GPa c. Reading from the graph what is the strain of the metal at the Yield Stress? Give your answer to three significant figures. Answer:
Step by Step Solution
3.54 Rating (151 Votes )
There are 3 Steps involved in it
Step: 1
141345 1246 12 JUEL 10 08 06 04 02 ay 1246GPa 0 OUT 1345GPa E 002 06 12 18 From ...
Get Instant Access to Expert-Tailored Solutions
See step-by-step solutions with expert insights and AI powered tools for academic success
Step: 2

Step: 3

Ace Your Homework with AI
Get the answers you need in no time with our AI-driven, step-by-step assistance
Get StartedRecommended Textbook for
Introduction to Java Programming, Comprehensive Version
Authors: Y. Daniel Liang
10th Edition
133761312, 978-0133761313
Students also viewed these Accounting questions
Question
Answered: 1 week ago
Question
Answered: 1 week ago
Question
Answered: 1 week ago
Question
Answered: 1 week ago
Question
Answered: 1 week ago
Question
Answered: 1 week ago
Question
Answered: 1 week ago
Question
Answered: 1 week ago
Question
Answered: 1 week ago
Question
Answered: 1 week ago
Question
Answered: 1 week ago
Question
Answered: 1 week ago
Question
Answered: 1 week ago
Question
Answered: 1 week ago
Question
Answered: 1 week ago
Question
Answered: 1 week ago
Question
Answered: 1 week ago
Question
Answered: 1 week ago
Question
Answered: 1 week ago
Question
Answered: 1 week ago
Question
Answered: 1 week ago
View Answer in SolutionInn App


