Question
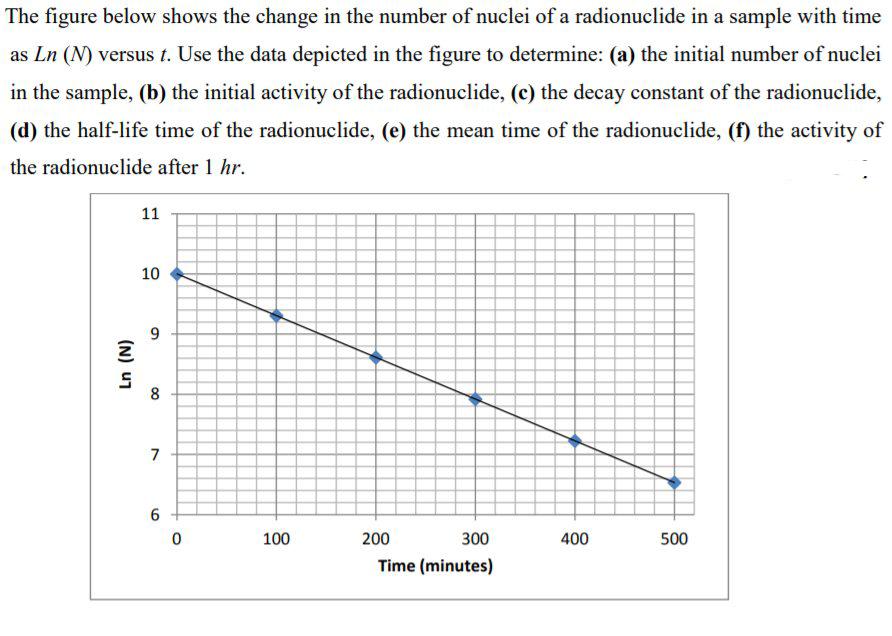
The figure below shows the change in the number of nuclei of a radionuclide in a sample with time as Ln (N) versus t.

The figure below shows the change in the number of nuclei of a radionuclide in a sample with time as Ln (N) versus t. Use the data depicted in the figure to determine: (a) the initial number of nuclei in the sample, (b) the initial activity of the radionuclide, (c) the decay constant of the radionuclide, (d) the half-life time of the radionuclide, (e) the mean time of the radionuclide, (f) the activity of the radionuclide after 1 hr. 11 10 100 200 300 400 500 Time (minutes) 7. (N) u1
Step by Step Solution
3.43 Rating (162 Votes )
There are 3 Steps involved in it
Step: 1

Get Instant Access to Expert-Tailored Solutions
See step-by-step solutions with expert insights and AI powered tools for academic success
Step: 2

Step: 3

Ace Your Homework with AI
Get the answers you need in no time with our AI-driven, step-by-step assistance
Get StartedRecommended Textbook for
Core Macroeconomics
Authors: Eric Chiang
3rd edition
978-1429278478, 1429278471, 978-1429278492, 1429278498, 1464191433, 978-1464191435
Students also viewed these Physics questions
Question
Answered: 1 week ago
Question
Answered: 1 week ago
Question
Answered: 1 week ago
Question
Answered: 1 week ago
Question
Answered: 1 week ago
Question
Answered: 1 week ago
Question
Answered: 1 week ago
Question
Answered: 1 week ago
Question
Answered: 1 week ago
Question
Answered: 1 week ago
Question
Answered: 1 week ago
Question
Answered: 1 week ago
Question
Answered: 1 week ago
Question
Answered: 1 week ago
Question
Answered: 1 week ago
Question
Answered: 1 week ago
Question
Answered: 1 week ago
Question
Answered: 1 week ago
Question
Answered: 1 week ago
Question
Answered: 1 week ago
View Answer in SolutionInn App


