Question
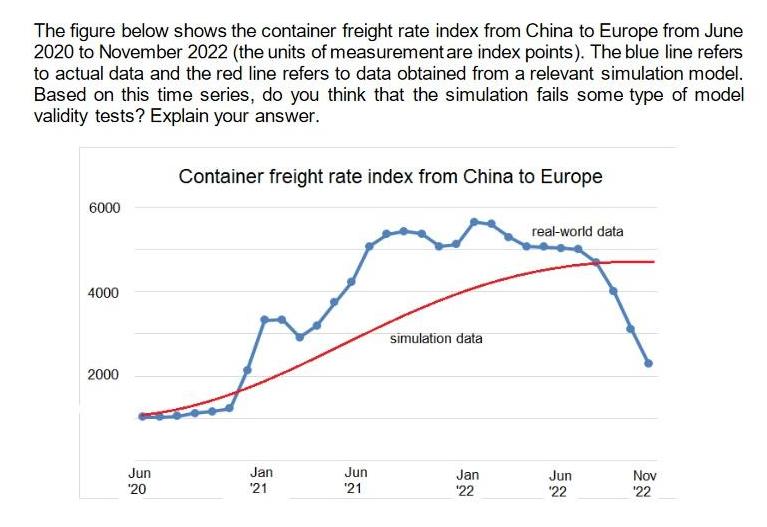
The figure below shows the container freight rate index from China to Europe from June 2020 to November 2022 (the units of measurement are

The figure below shows the container freight rate index from China to Europe from June 2020 to November 2022 (the units of measurement are index points). The blue line refers to actual data and the red line refers to data obtained from a relevant simulation model. Based on this time series, do you think that the simulation fails some type of model validity tests? Explain your answer. 6000 4000 2000 Jun '20 Container freight rate index from China to Europe Jan 21 Jun 21 simulation data Jan 22 real-world data Jun 22 Nov 22
Step by Step Solution
3.37 Rating (150 Votes )
There are 3 Steps involved in it
Step: 1
Step 11 Based upon the information provided in the question Without more informat...
Get Instant Access to Expert-Tailored Solutions
See step-by-step solutions with expert insights and AI powered tools for academic success
Step: 2

Step: 3

Ace Your Homework with AI
Get the answers you need in no time with our AI-driven, step-by-step assistance
Get StartedRecommended Textbook for
International Accounting
Authors: Timothy Doupnik, Hector Perera
3rd Edition
978-0078110955, 0078110955
Students also viewed these General Management questions
Question
Answered: 1 week ago
Question
Answered: 1 week ago
Question
Answered: 1 week ago
Question
Answered: 1 week ago
Question
Answered: 1 week ago
Question
Answered: 1 week ago
Question
Answered: 1 week ago
Question
Answered: 1 week ago
Question
Answered: 1 week ago
Question
Answered: 1 week ago
Question
Answered: 1 week ago
Question
Answered: 1 week ago
Question
Answered: 1 week ago
Question
Answered: 1 week ago
Question
Answered: 1 week ago
Question
Answered: 1 week ago
Question
Answered: 1 week ago
Question
Answered: 1 week ago
Question
Answered: 1 week ago
Question
Answered: 1 week ago
Question
Answered: 1 week ago
Question
Answered: 1 week ago
View Answer in SolutionInn App


