

Answered step by step
Verified Expert Solution
Question
1 Approved Answer
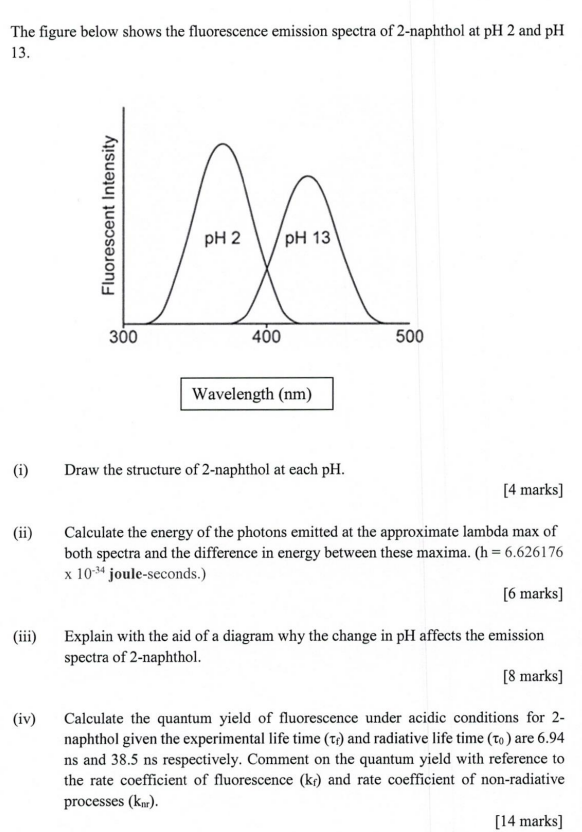
The figure below shows the fluorescence emission spectra of 2-naphthol at pH2 and pH 13. Wavelength (nm) (i) Draw the structure of 2-naphthol at each
Step by Step Solution
There are 3 Steps involved in it
Step: 1

Get Instant Access to Expert-Tailored Solutions
See step-by-step solutions with expert insights and AI powered tools for academic success
Step: 2

Step: 3
Ace Your Homework with AI
Get the answers you need in no time with our AI-driven, step-by-step assistance
Get Started
Organic Chemistry structure and function
Authors: K. Peter C. Vollhardt, Neil E. Schore
6th edition
142920494X, 978-1429204941