Question
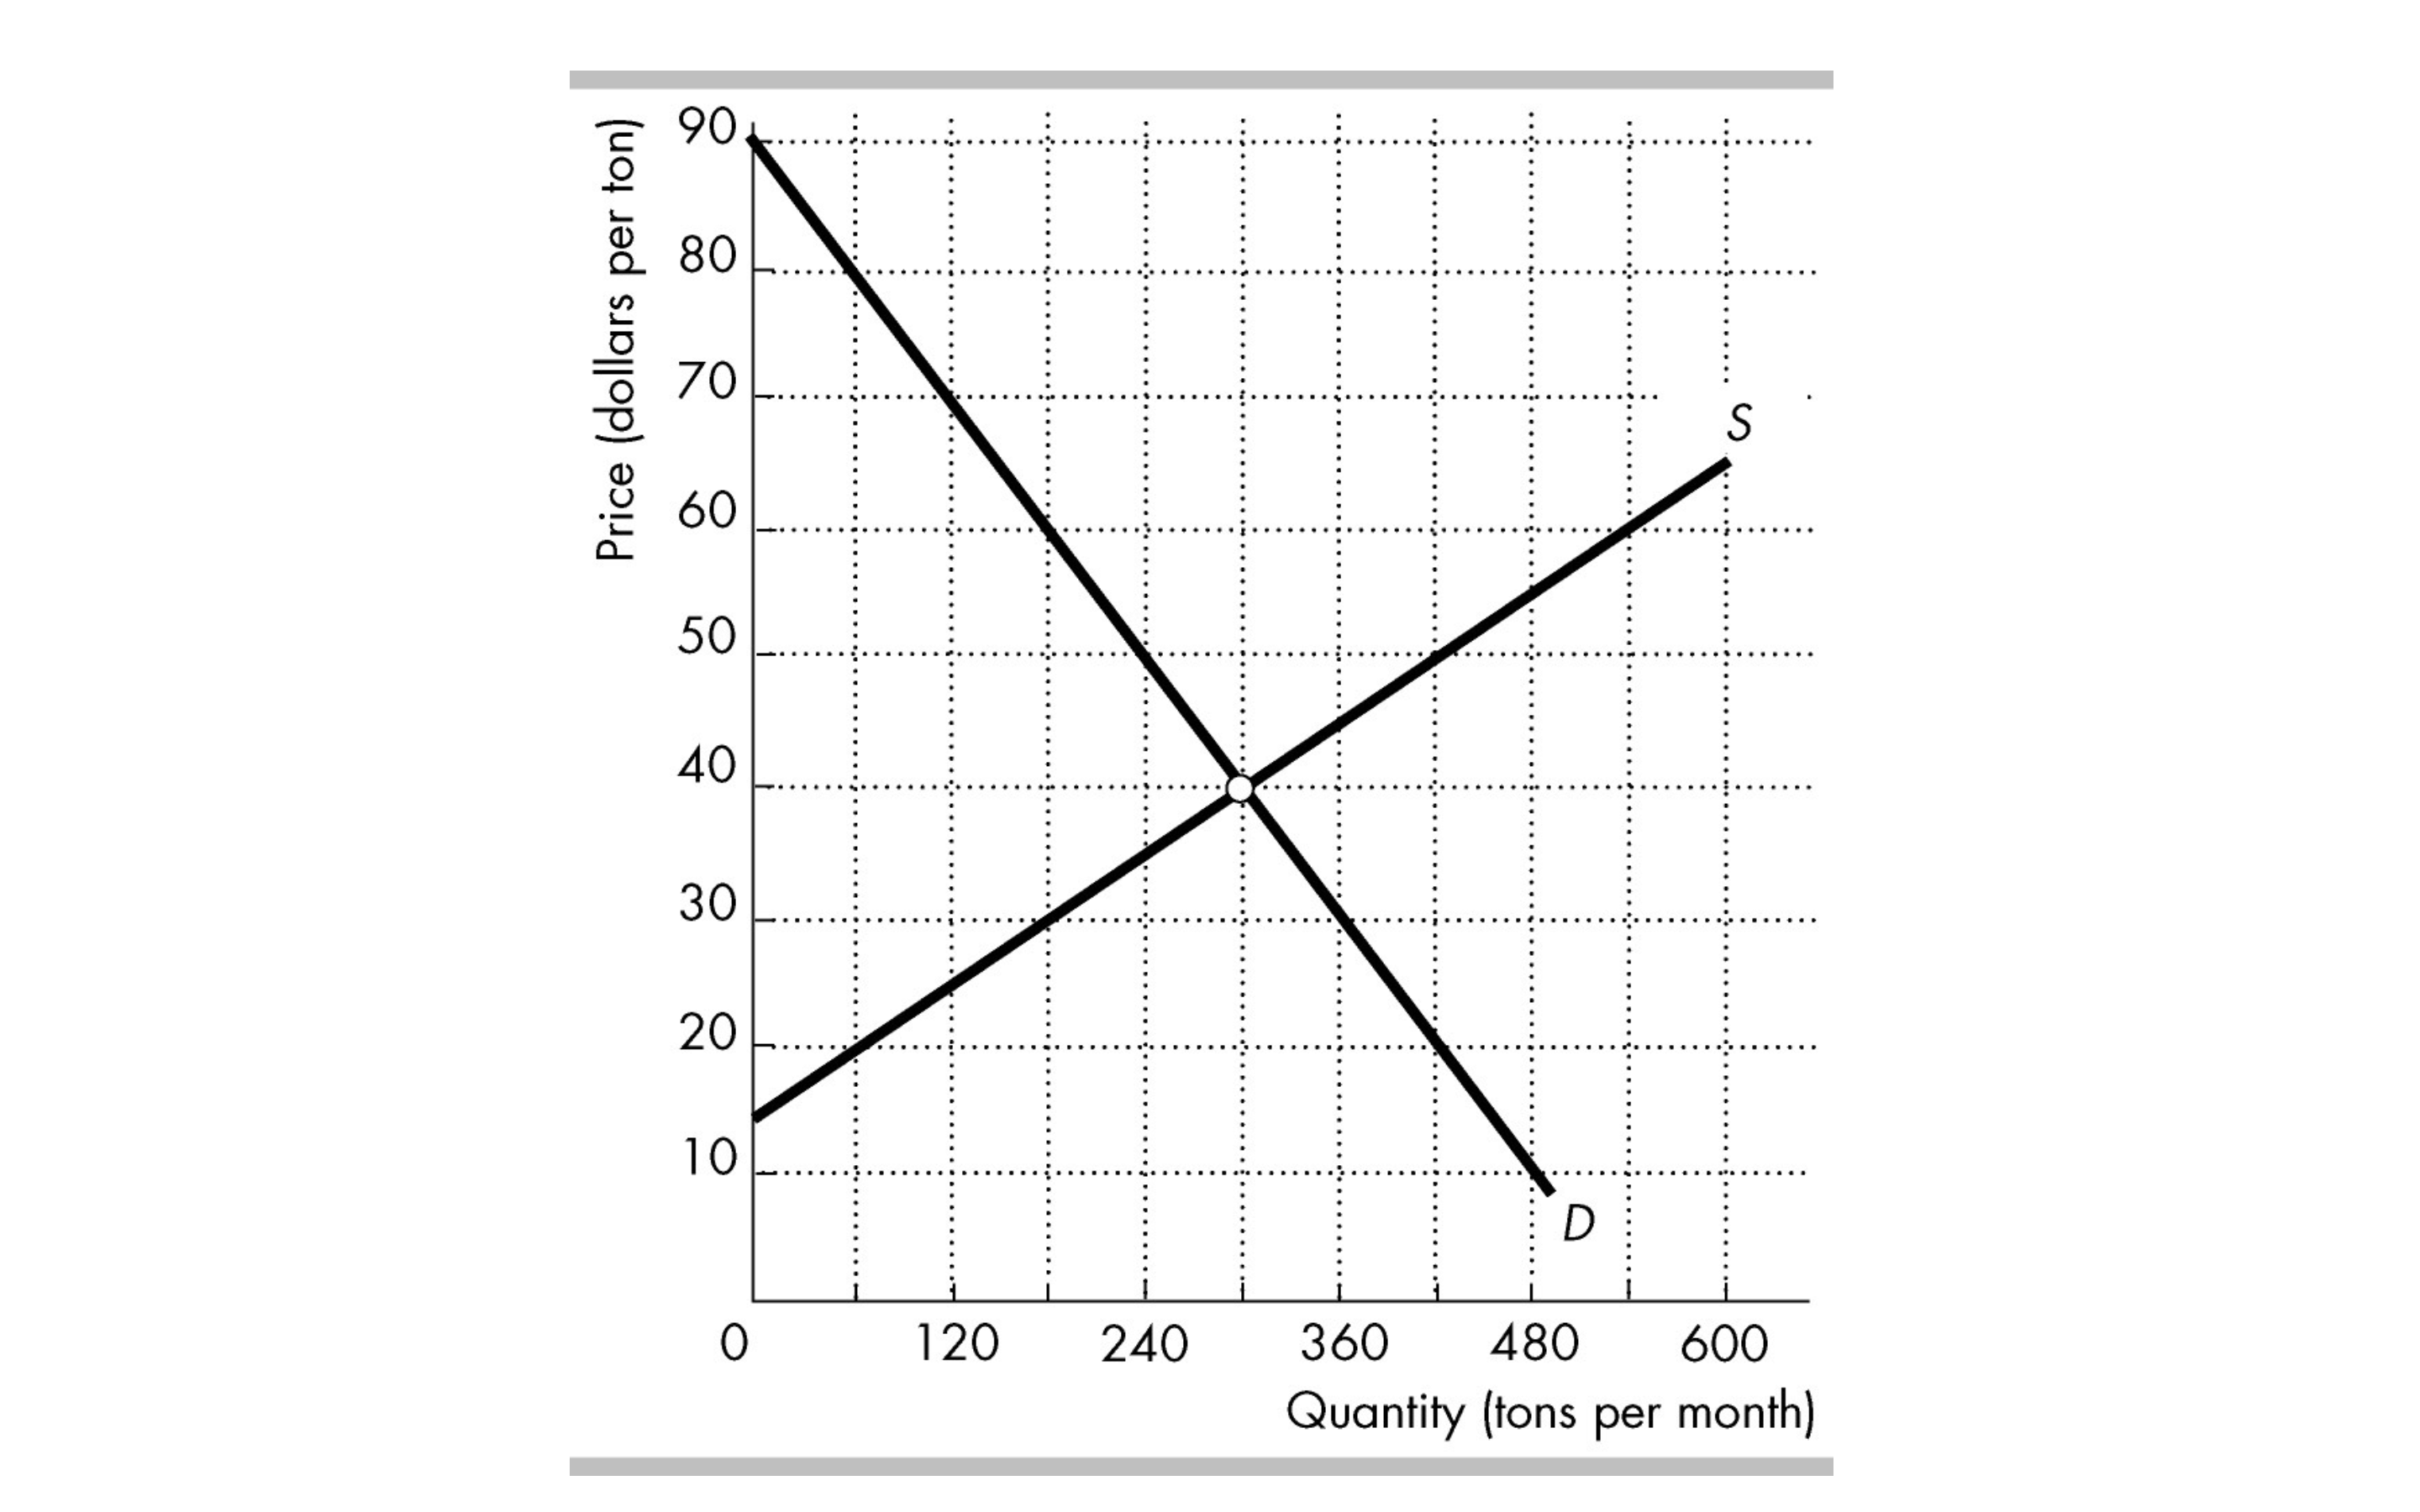
The figure below shows the unregulated market for a pesticide, whereSis the supply curve andDis the demand curve. The demand curve is the same as
The figure below shows the unregulated market for a pesticide, whereSis the supply curve andDis the demand curve. The demand curve is the same as theMSBcurve. When factories produce the pesticide, they also create waste, which they dump into a lake on the outskirts of the town.The marginal external cost of the dumped waste is equal to the marginal private cost of producing the pesticide.
Problem a. Plot the marginal social cost (MSC) curve on the same graph. If the output is 180 tons per month, what is the marginal social cost of producing the pesticide?
Problem b. What is the efficient quantity of pesticide to produce? Will the external cost lead to underproduction or overproduction of pesticide in the market equilibrium?
Problem c. Mark the deadweight loss of the market equilibrium on the graph. How large is the deadweight loss?
Problem d. What are the possible policies the government could adopt to overcome the ineffi- ciency/internalize the externalities?

Step by Step Solution
There are 3 Steps involved in it
Step: 1

Get Instant Access to Expert-Tailored Solutions
See step-by-step solutions with expert insights and AI powered tools for academic success
Step: 2

Step: 3

Ace Your Homework with AI
Get the answers you need in no time with our AI-driven, step-by-step assistance
Get Started


