Answered step by step
Verified Expert Solution
Question
1 Approved Answer
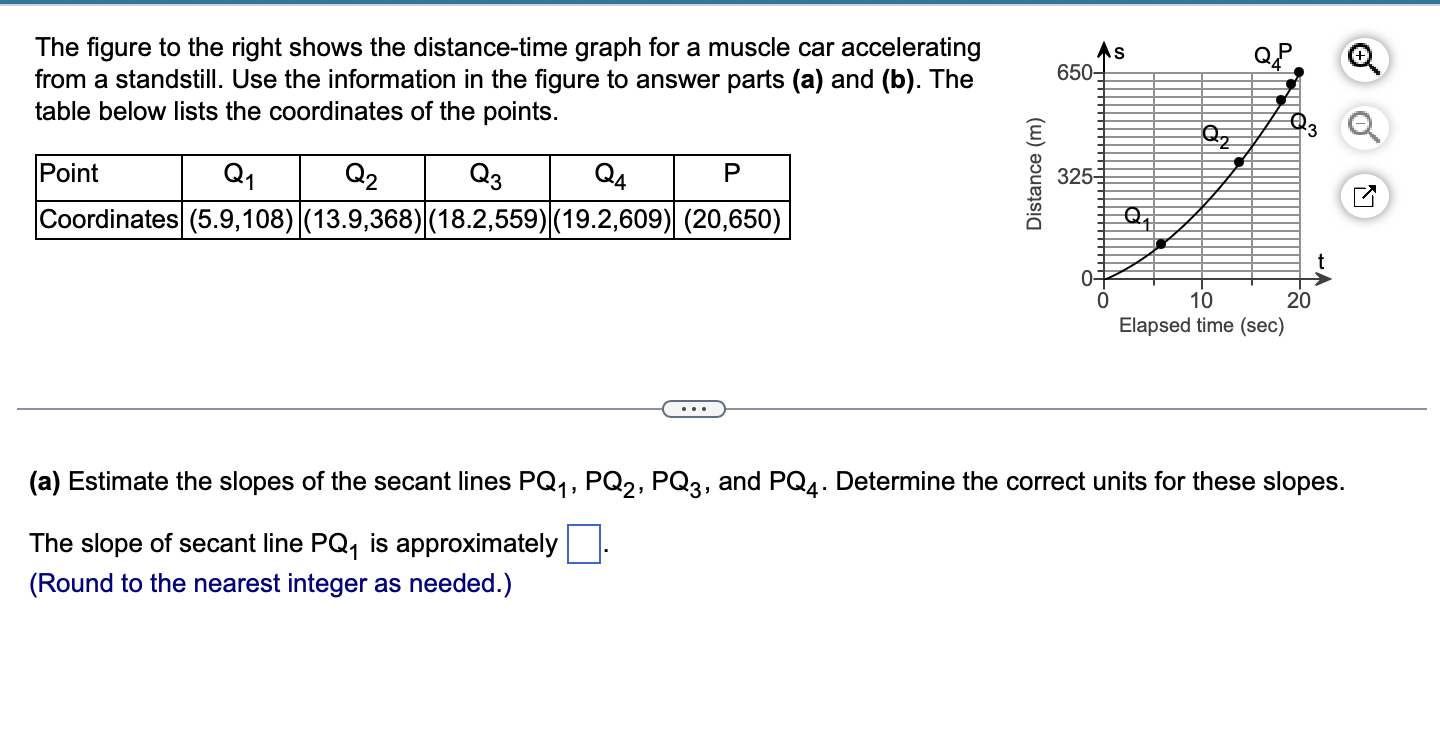
The figure to the right shows the distance-time graph for a muscle car accelerating from a standstill. Use the information in the figure to

The figure to the right shows the distance-time graph for a muscle car accelerating from a standstill. Use the information in the figure to answer parts (a) and (b). The table below lists the coordinates of the points. Point Q1 Q2 Q3 Q4 P Coordinates (5.9,108) (13.9,368) (18.2,559) (19.2,609) (20,650) Distance (m) 650 + 325- Q. 10 Elapsed time (sec) 20 -0 (a) Estimate the slopes of the secant lines PQ, PQ2, PQ3, and PQ4. Determine the correct units for these slopes. The slope of secant line PQ is approximately (Round to the nearest integer as needed.)
Step by Step Solution
There are 3 Steps involved in it
Step: 1

Get Instant Access to Expert-Tailored Solutions
See step-by-step solutions with expert insights and AI powered tools for academic success
Step: 2

Step: 3

Ace Your Homework with AI
Get the answers you need in no time with our AI-driven, step-by-step assistance
Get Started


