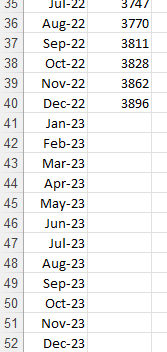
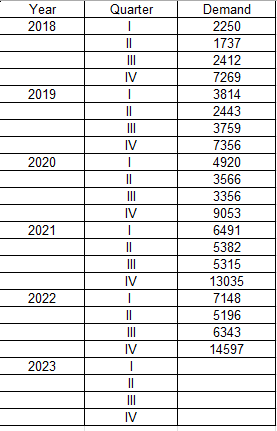
The file Case-1- data contains data for problems 1 and 2.
Problem 1: Use the Problem-1 data to answer the following questions (15 points)
- What is the forecast for January of the year 2020 using Holts method ? (4 points)
- Use Solver to estimate the optimal value of smoothing constants () that minimize MSE and evaluate the MSE based on the optimal value of.
MSE = (4 points)
- What is the forecast for June of the year 2020 using Holts methodbased on the optimal value? (4 points)
- Comment on the appropriateness of this forecasting method (Explain). (2 points)
Question 2: Use the Problem-2 data to answer the following questions (20 points).
- What is the forecast for quarter 1 of the year 2018? (4 points)
- What is the forecast from quarter 1 to quarter 4 of the year 2023 (16 points)


\begin{tabular}{|r|r|r|} \hline 1 & Monthly sales data \\ \hline 3 & Month & Demand \\ \hline 4 & & \\ \hline 5 & Jan-20 & 2901 \\ \hline 6 & Feb-20 & 2932 \\ \hline 7 & Mar-20 & 2958 \\ \hline 8 & Apr-20 & 2974 \\ \hline 9 & May-20 & 3008 \\ \hline 10 & Jun-20 & 3027 \\ \hline 11 & Jul-20 & 3044 \\ \hline 12 & Aug-20 & 3071 \\ \hline 13 & Sep-20 & 3098 \\ \hline 14 & Oct-20 & 3108 \\ \hline 15 & Nov-20 & 3134 \\ \hline 16 & Dec-20 & 3168 \\ \hline 17 & Jan-21 & 3186 \\ \hline 18 & Feb-21 & 3221 \\ \hline 19 & Mar-21 & 3256 \\ \hline 20 & Apr-21 & 3295 \\ \hline 21 & May-21 & 3322 \\ \hline 22 & Jun-21 & 3343 \\ \hline 23 & Jul-21 & 3368 \\ \hline 24 & Aug-21 & 3407 \\ \hline 25 & Sep-21 & 3426 \\ \hline 26 & Oct-21 & 3455 \\ \hline 27 & Nov-21 & 3483 \\ \hline 28 & Dec-21 & 3509 \\ \hline 29 & Jan-22 & 3538 \\ \hline 30 & Feb-22 & 3582 \\ \hline 31 & Mar-22 & 3600 \\ \hline 32 & Apr-22 & 3652 \\ \hline 33 & May-22 & 3686 \\ \hline 35 & Jun-22 & 3722 \\ \hline Jul-22 & 3747 \\ \hline 3 Sep-22 & 3811 \\ \hline \end{tabular} \begin{tabular}{|r|r|r|} \hline 35 & Jul-22 & 3/47 \\ \hline 36 & Aug-22 & 3770 \\ \hline 38 & Sep-22 & 3811 \\ \hline 39 & Oct-22 & 3828 \\ \hline 40 & Dev-22 & 3862 \\ \hline 41 & Jan-23 & 3896 \\ \hline 42 & Feb-23 & \\ \hline 43 & Mar-23 & \\ \hline 44 & Apr-23 & \\ \hline 45 & May-23 & \\ \hline 46 & Jun-23 \\ \hline 47 & Jul-23 \\ \hline 48 & Aug-23 \\ \hline 49 & Sep-23 \\ \hline 50 & Oct-23 \\ \hline 51 & Nov-23 \\ \hline 52 & Dec-23 & \\ \hline \end{tabular} \begin{tabular}{|r|r|r|} \hline 1 & Monthly sales data \\ \hline 3 & Month & Demand \\ \hline 4 & & \\ \hline 5 & Jan-20 & 2901 \\ \hline 6 & Feb-20 & 2932 \\ \hline 7 & Mar-20 & 2958 \\ \hline 8 & Apr-20 & 2974 \\ \hline 9 & May-20 & 3008 \\ \hline 10 & Jun-20 & 3027 \\ \hline 11 & Jul-20 & 3044 \\ \hline 12 & Aug-20 & 3071 \\ \hline 13 & Sep-20 & 3098 \\ \hline 14 & Oct-20 & 3108 \\ \hline 15 & Nov-20 & 3134 \\ \hline 16 & Dec-20 & 3168 \\ \hline 17 & Jan-21 & 3186 \\ \hline 18 & Feb-21 & 3221 \\ \hline 19 & Mar-21 & 3256 \\ \hline 20 & Apr-21 & 3295 \\ \hline 21 & May-21 & 3322 \\ \hline 22 & Jun-21 & 3343 \\ \hline 23 & Jul-21 & 3368 \\ \hline 24 & Aug-21 & 3407 \\ \hline 25 & Sep-21 & 3426 \\ \hline 26 & Oct-21 & 3455 \\ \hline 27 & Nov-21 & 3483 \\ \hline 28 & Dec-21 & 3509 \\ \hline 29 & Jan-22 & 3538 \\ \hline 30 & Feb-22 & 3582 \\ \hline 31 & Mar-22 & 3600 \\ \hline 32 & Apr-22 & 3652 \\ \hline 33 & May-22 & 3686 \\ \hline 35 & Jun-22 & 3722 \\ \hline Jul-22 & 3747 \\ \hline 3 Sep-22 & 3811 \\ \hline \end{tabular} \begin{tabular}{|r|r|r|} \hline 35 & Jul-22 & 3/47 \\ \hline 36 & Aug-22 & 3770 \\ \hline 38 & Sep-22 & 3811 \\ \hline 39 & Oct-22 & 3828 \\ \hline 40 & Dev-22 & 3862 \\ \hline 41 & Jan-23 & 3896 \\ \hline 42 & Feb-23 & \\ \hline 43 & Mar-23 & \\ \hline 44 & Apr-23 & \\ \hline 45 & May-23 & \\ \hline 46 & Jun-23 \\ \hline 47 & Jul-23 \\ \hline 48 & Aug-23 \\ \hline 49 & Sep-23 \\ \hline 50 & Oct-23 \\ \hline 51 & Nov-23 \\ \hline 52 & Dec-23 & \\ \hline \end{tabular}


