

Question
The file contains the monthly returns of 4 stocks over the 10 year period -- January 1997 -- December 2006. In this file, the expected
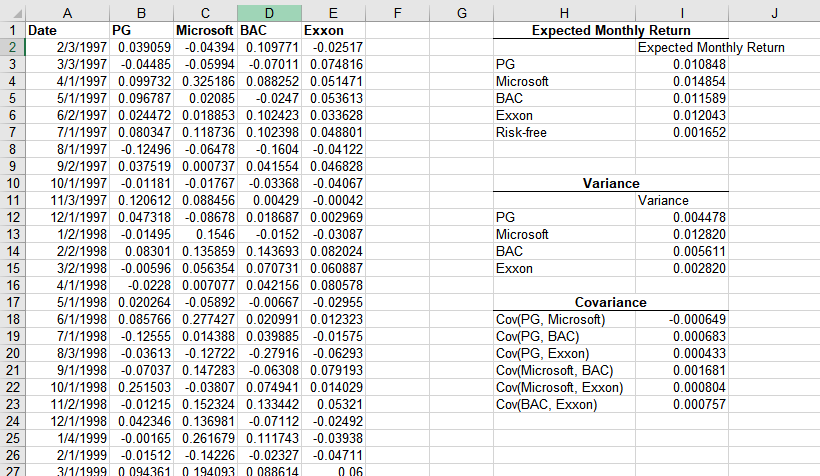
The file contains the monthly returns of 4 stocks over the 10 year period -- January 1997 -- December 2006. In this file, the expected monthly return for each stock is calculated using excel function AVERAGE (), for each stock, the variance of monthly returns is calculated using Excel function VAR (), and the covariance between the returns of each pair of stocks is calculated using Excel function COVAR (). Assume that the yearly risk free rate is 2% (A monthly risk free rate of 0.001652).
(a) Plot the minimum variance frontier for an investor who wants to allocate his money to PG, BAC, and the risk-free asset. Find the optimal risky portfolio. What are the mean and s.d. of the returns of this portfolio?
F Expected Monthly Return Expected Monthly Return PG 0.010848 Microsoft 0.014854 BAC 0.011589 Exxon 0.012043 Risk-free 0.001652 PG A B C D E 1 1 Date PG Microsoft BAC Exxon 2 2/3/1997 0.039059 -0.04394 0.109771 -0.02517 3/3/1997 -0.04485 -0.05994 -0.07011 0.074816 4/1/1997 0.099732 0.325186 0.088252 0.051471 5/1/1997 0.096787 0.02085 -0.0247 0.053613 6/2/1997 0.024472 0.018853 0.102423 0.033628 7/1/1997 0.080347 0.118736 0.102398 0.048801 8/1/1997 -0.12496 -0.06478 -0.1604 -0.04122 9 9/2/1997 0.037519 0.000737 0.041554 0.046828 10 10/1/1997 -0.01181 -0.01767 -0.03368 -0.04067 11 11/3/1997 0.120612 0.088456 0.00429 -0.00042 12/1/1997 0.047318 -0.08678 0.018687 0.002969 1/2/1998 -0.01495 0.1546 -0.0152 -0.03087 2/2/1998 0.08301 0.135859 0.143693 0.082024 3/2/1998 -0.00596 0.056354 0.070731 0.060887 4/1/1998 -0.0228 0.007077 0.042156 0.080578 5/1/1998 0.020264 -0.05892 -0.00667 -0.02955 18 6/1/1998 0.085766 0.277427 0.020991 0.012323 7/1/1998 -0.12555 0.014388 0.039885 -0.01575 8/3/1998 -0.03613 -0.12722 -0.27916 -0.06293 9/1/1998 -0.07037 0.147283 -0.06308 0.079193 10/1/1998 0.251503 -0.03807 0.074941 0.014029 11/2/1998 -0.01215 0.152324 0.133442 0.05321 12/1/1998 0.042346 0.136981 -0.07112 -0.02492 1/4/1999 -0.00165 0.261679 0.111743 -0.03938 2/1/1999 -0.01512 -0.14226 -0.02327 -0.04711 3/1/1999 094361 194093 0088614 006 13 Microsoft BAC Exxon Variance Variance 0.004478 0.012820 0.005611 0.002820 19 Covariance Cov(PG, Microsoft) Cov(PG, BAC) Cov(PG, Exxon) Cov(Microsoft, BAC) Cov(Microsoft, Exxon) Cov(BAC, Exxon) -0.000649 0.000683 0.000433 0.001681 0.000804 0.000757 F Expected Monthly Return Expected Monthly Return PG 0.010848 Microsoft 0.014854 BAC 0.011589 Exxon 0.012043 Risk-free 0.001652 PG A B C D E 1 1 Date PG Microsoft BAC Exxon 2 2/3/1997 0.039059 -0.04394 0.109771 -0.02517 3/3/1997 -0.04485 -0.05994 -0.07011 0.074816 4/1/1997 0.099732 0.325186 0.088252 0.051471 5/1/1997 0.096787 0.02085 -0.0247 0.053613 6/2/1997 0.024472 0.018853 0.102423 0.033628 7/1/1997 0.080347 0.118736 0.102398 0.048801 8/1/1997 -0.12496 -0.06478 -0.1604 -0.04122 9 9/2/1997 0.037519 0.000737 0.041554 0.046828 10 10/1/1997 -0.01181 -0.01767 -0.03368 -0.04067 11 11/3/1997 0.120612 0.088456 0.00429 -0.00042 12/1/1997 0.047318 -0.08678 0.018687 0.002969 1/2/1998 -0.01495 0.1546 -0.0152 -0.03087 2/2/1998 0.08301 0.135859 0.143693 0.082024 3/2/1998 -0.00596 0.056354 0.070731 0.060887 4/1/1998 -0.0228 0.007077 0.042156 0.080578 5/1/1998 0.020264 -0.05892 -0.00667 -0.02955 18 6/1/1998 0.085766 0.277427 0.020991 0.012323 7/1/1998 -0.12555 0.014388 0.039885 -0.01575 8/3/1998 -0.03613 -0.12722 -0.27916 -0.06293 9/1/1998 -0.07037 0.147283 -0.06308 0.079193 10/1/1998 0.251503 -0.03807 0.074941 0.014029 11/2/1998 -0.01215 0.152324 0.133442 0.05321 12/1/1998 0.042346 0.136981 -0.07112 -0.02492 1/4/1999 -0.00165 0.261679 0.111743 -0.03938 2/1/1999 -0.01512 -0.14226 -0.02327 -0.04711 3/1/1999 094361 194093 0088614 006 13 Microsoft BAC Exxon Variance Variance 0.004478 0.012820 0.005611 0.002820 19 Covariance Cov(PG, Microsoft) Cov(PG, BAC) Cov(PG, Exxon) Cov(Microsoft, BAC) Cov(Microsoft, Exxon) Cov(BAC, Exxon) -0.000649 0.000683 0.000433 0.001681 0.000804 0.000757Step by Step Solution
There are 3 Steps involved in it
Step: 1

Get Instant Access to Expert-Tailored Solutions
See step-by-step solutions with expert insights and AI powered tools for academic success
Step: 2

Step: 3
Ace Your Homework with AI
Get the answers you need in no time with our AI-driven, step-by-step assistance
Get Started
Term Structure Models A Graduate Course
Authors: Damir Filipovic
2009th Edition
364226915X, 978-3642269158