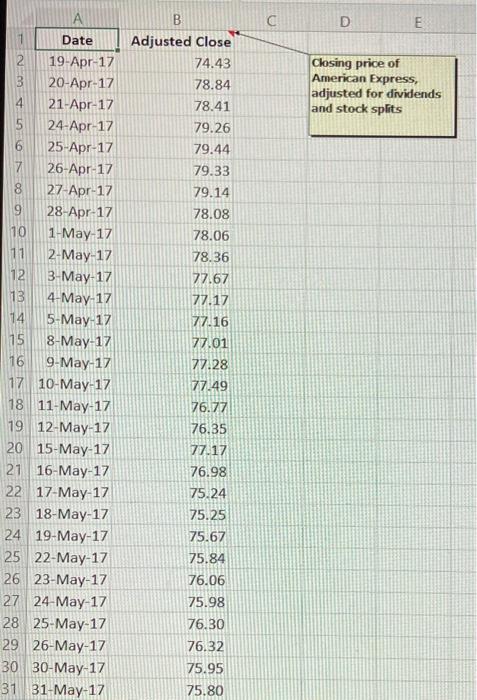
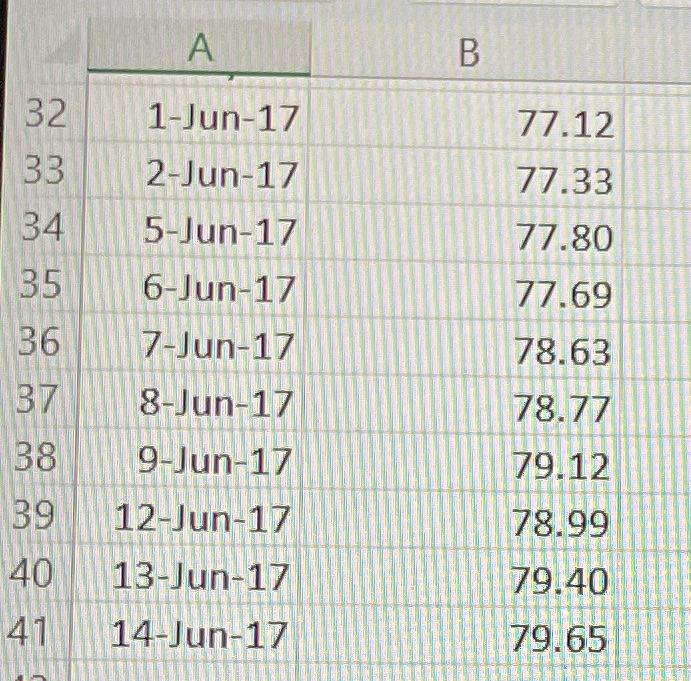
The file P12_16 xlsx contains the daly closing prices of American Express stock for an eight-week period. a. Using a span of 3, foreclast the price of this stock for the next trading day with the moving average mothod. Round your answer to the nearest cent, if necessary. How well does this method with span 3 forecast the known observations in this series? Round your answer to three decimal places, if necessary. Root mean square error: b. Using a span of 6, forecast the price of thas stock for the next trading day with the moving average method. Pound your answer to the nearest cent, if necessary. How well does this method with span 6 forecast the known observations in this series? Round your answer to three decimal places, if necessary. Poot mean sizuare error: \begin{tabular}{|c|c|c|c|c|} \hline & A & B & C & D \\ \hline 11 & Date & Adjusted Close & & \\ \hline 2 & 19-Apr-17 & 74.43 & & \multirow{4}{*}{\begin{tabular}{l} Closing price of \\ American Express, \\ adjusted for dividends \\ and stock splits \end{tabular}} \\ \hline 3 & 20-Apr-17 & 78.84 & & \\ \hline 4 & 21-Apr-17 & 78.41 & & \\ \hline 5 & 24-Apr-17 & 79.26 & & \\ \hline 6 & 25-Apr-17 & 79.44 & & \\ \hline 7 & 26-Apr-17 & 79.33 & & \\ \hline 8 & 27-Apr-17 & 79.14 & & \\ \hline 9 & 28-Apr-17 & 78.08 & & \\ \hline 10 & 1-May-17 & 78.06 & & \\ \hline 11 & 2-May-17 & 78.36 & & \\ \hline 12 & 3-May-17 & 77.67 & & \\ \hline 13 & 4-May-17 & 77.17 & & \\ \hline 14 & 5-May-17 & 77.16 & & \\ \hline 15 & 8-May-17 & 77.01 & & \\ \hline 16 & 9-May-17 & 77.28 & & \\ \hline 17 & 10-May-17 & 77.49 & & \\ \hline 18 & 11-May-17 & 76.77 & & \\ \hline 19 & 12-May-17 & 76.35 & & \\ \hline 20 & 15-May-17 & 77.17 & & \\ \hline 21 & 16-May-17 & 76.98 & & \\ \hline 22 & 17-May-17 & 75.24 & & \\ \hline 23 & 18-May-17 & 75.25 & & \\ \hline 24 & 19-May-17 & 75.67 & & \\ \hline 25 & 22-May-17 & 75.84 & & \\ \hline 26 & 23-May-17 & 76.06 & & \\ \hline 27 & 24-May-17 & 75.98 & & \\ \hline 28 & 25-May-17 & 76.30 & & \\ \hline 29 & 26-May-17 & 76.32 & & \\ \hline 30 & 30-May-17 & 75.95 & & \\ \hline 31 & 31-May-17 & 75.80 & & \\ \hline \end{tabular} \begin{tabular}{|c|c|} \hline A & \\ \hline 1-Jun-17 & 77.12 \\ \hline 2-Jun-17 & 77.33 \\ \hline 5-Jun-17 & 77.80 \\ \hline 6-Jun-17 & 77.69 \\ \hline 7-Jun-17 & 78.63 \\ \hline 8-Jun-17 & 78.77 \\ \hline 9-Jun-17 & 79.12 \\ \hline 12Jun17 & 78.99 \\ \hline 13J un-17 & 79.40 \\ \hline 14-Jun-17 & 79.65 \\ \hline \end{tabular}


