Question
The finance group at CATS is working on forecasting its financial statements for 20Y5. They are working with the following assumptions: CATS will invest $180,000
The finance group at CATS is working on forecasting its financial statements for 20Y5. They are working with the following assumptions:
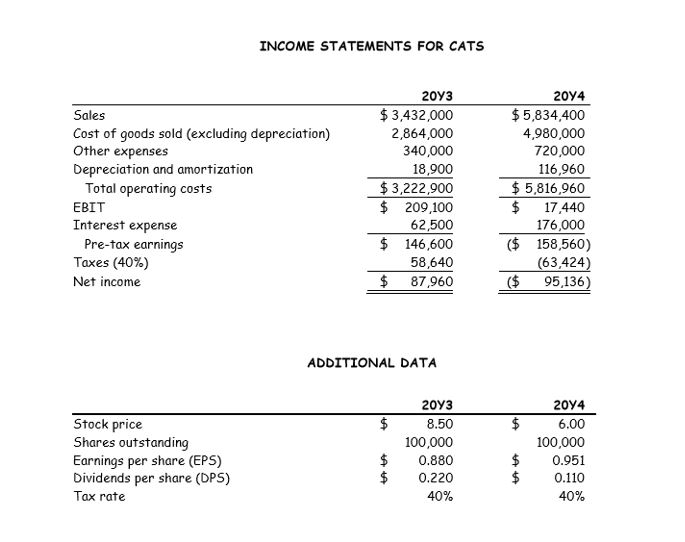
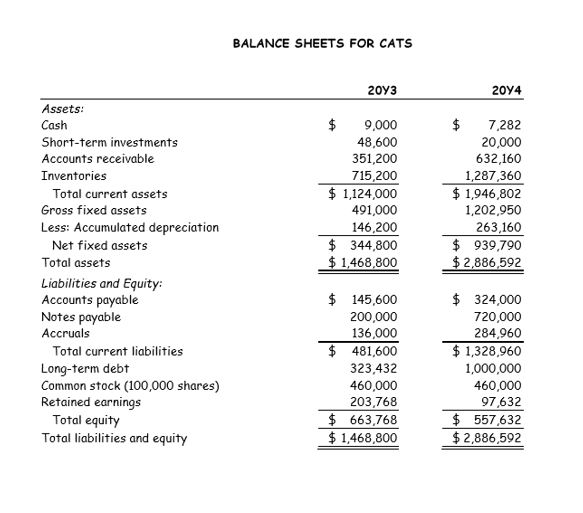
CATS will invest $180,000 in fixed assets in 20Y5; depreciation expense will increase by $17,469 in 20Y5 over the 20Y4 amount.
CATS will fund the investment in fixed assets with a long-term loan of $180,000. Interest expense will increase by $16,300 in 20Y5 over the 20Y4 amount. There will no change in the number of shares of common stock.
CATS will increase its common dividend by 5%.
The marketing group estimates that sales will increase 12.5% in 20Y5.
All NOWC accounts, except cash, will increase by 10% over the 20Y4 amounts. The ending cash balance for 20Y5 is expected to increase 22% over the 20Y4 amount. ST investments will remain constant.
The ratio of operating expenses (excluding other expenses and depreciation) to sales will decline from ~85.4% to 83%. The other expenses item on the income statement will increase 3%. The tax rate will remain at 40%.
The WACC for CATS is expected to remain at 10% for 20Y5.
Any additional funds needed (AFN) will come from a short-term borrowing, i.e., an increase in notes payable. Similarly, any funds released would be used to reduce notes payable. In other words, notes payable is a plug variable which will be used to balance the balance sheet.
d. Estimate EVA and MVA for CATS for 20Y5. Assume CATS stock price will increase 20% from year-end 20Y4 to year-end 20Y5.
INCOME STATEMENTS FOR CATS Sales Cost of goods sold (excluding depreciation) Other expenses Depreciation and amortization Total operating costs EBIT Interest expense Pre-tax earnings Taxes (40%) Net income 2013 $ 3,432,000 2,864,000 340,000 18,900 $3,222,900 $ 209,100 62,500 $ 146,600 58,640 $ 87,960 2014 $5,834,400 4,980,000 720,000 116,960 $ 5,816,960 17,440 176,000 ($ 158,560) (63,424) ($ 95,136) ADDITIONAL DATA $ $ Stock price Shares outstanding Earnings per share (EPS) Dividends per share (DPS) Tax rate 2013 8.50 100,000 0.880 0.220 40% 2014 6.00 100,000 0.951 0.110 40% $ $ $ ta BALANCE SHEETS FOR CATS 2013 2014 $ 9,000 48,600 351,200 715,200 $ 1,124,000 491,000 146,200 $ 344,800 $ 1,468,800 7,282 20,000 632,160 1,287,360 $ 1,946,802 1,202,950 263,160 $ 939,790 $ 2,886,592 Assets: Cash Short-term investments Accounts receivable Inventories Total current assets Gross fixed assets Less: Accumulated depreciation Net fixed assets Total assets Liabilities and Equity: Accounts payable Notes payable Accruals Total current liabilities Long-term debt Common stock (100,000 shares) Retained earnings Total equity Total liabilities and equity $ 145,600 200,000 136,000 $ 481,600 323,432 460,000 203,768 $ 663,768 $ 1,468,800 $ 324,000 720,000 284,960 $ 1,328,960 1,000,000 460,000 97,632 $ 557,632 $ 2,886,592 INCOME STATEMENTS FOR CATS Sales Cost of goods sold (excluding depreciation) Other expenses Depreciation and amortization Total operating costs EBIT Interest expense Pre-tax earnings Taxes (40%) Net income 2013 $ 3,432,000 2,864,000 340,000 18,900 $3,222,900 $ 209,100 62,500 $ 146,600 58,640 $ 87,960 2014 $5,834,400 4,980,000 720,000 116,960 $ 5,816,960 17,440 176,000 ($ 158,560) (63,424) ($ 95,136) ADDITIONAL DATA $ $ Stock price Shares outstanding Earnings per share (EPS) Dividends per share (DPS) Tax rate 2013 8.50 100,000 0.880 0.220 40% 2014 6.00 100,000 0.951 0.110 40% $ $ $ ta BALANCE SHEETS FOR CATS 2013 2014 $ 9,000 48,600 351,200 715,200 $ 1,124,000 491,000 146,200 $ 344,800 $ 1,468,800 7,282 20,000 632,160 1,287,360 $ 1,946,802 1,202,950 263,160 $ 939,790 $ 2,886,592 Assets: Cash Short-term investments Accounts receivable Inventories Total current assets Gross fixed assets Less: Accumulated depreciation Net fixed assets Total assets Liabilities and Equity: Accounts payable Notes payable Accruals Total current liabilities Long-term debt Common stock (100,000 shares) Retained earnings Total equity Total liabilities and equity $ 145,600 200,000 136,000 $ 481,600 323,432 460,000 203,768 $ 663,768 $ 1,468,800 $ 324,000 720,000 284,960 $ 1,328,960 1,000,000 460,000 97,632 $ 557,632 $ 2,886,592Step by Step Solution
There are 3 Steps involved in it
Step: 1
Get Instant Access to Expert-Tailored Solutions
See step-by-step solutions with expert insights and AI powered tools for academic success
Step: 2
Step: 3
Ace Your Homework with AI
Get the answers you need in no time with our AI-driven, step-by-step assistance
Get Started