Answered step by step
Verified Expert Solution
Question
1 Approved Answer
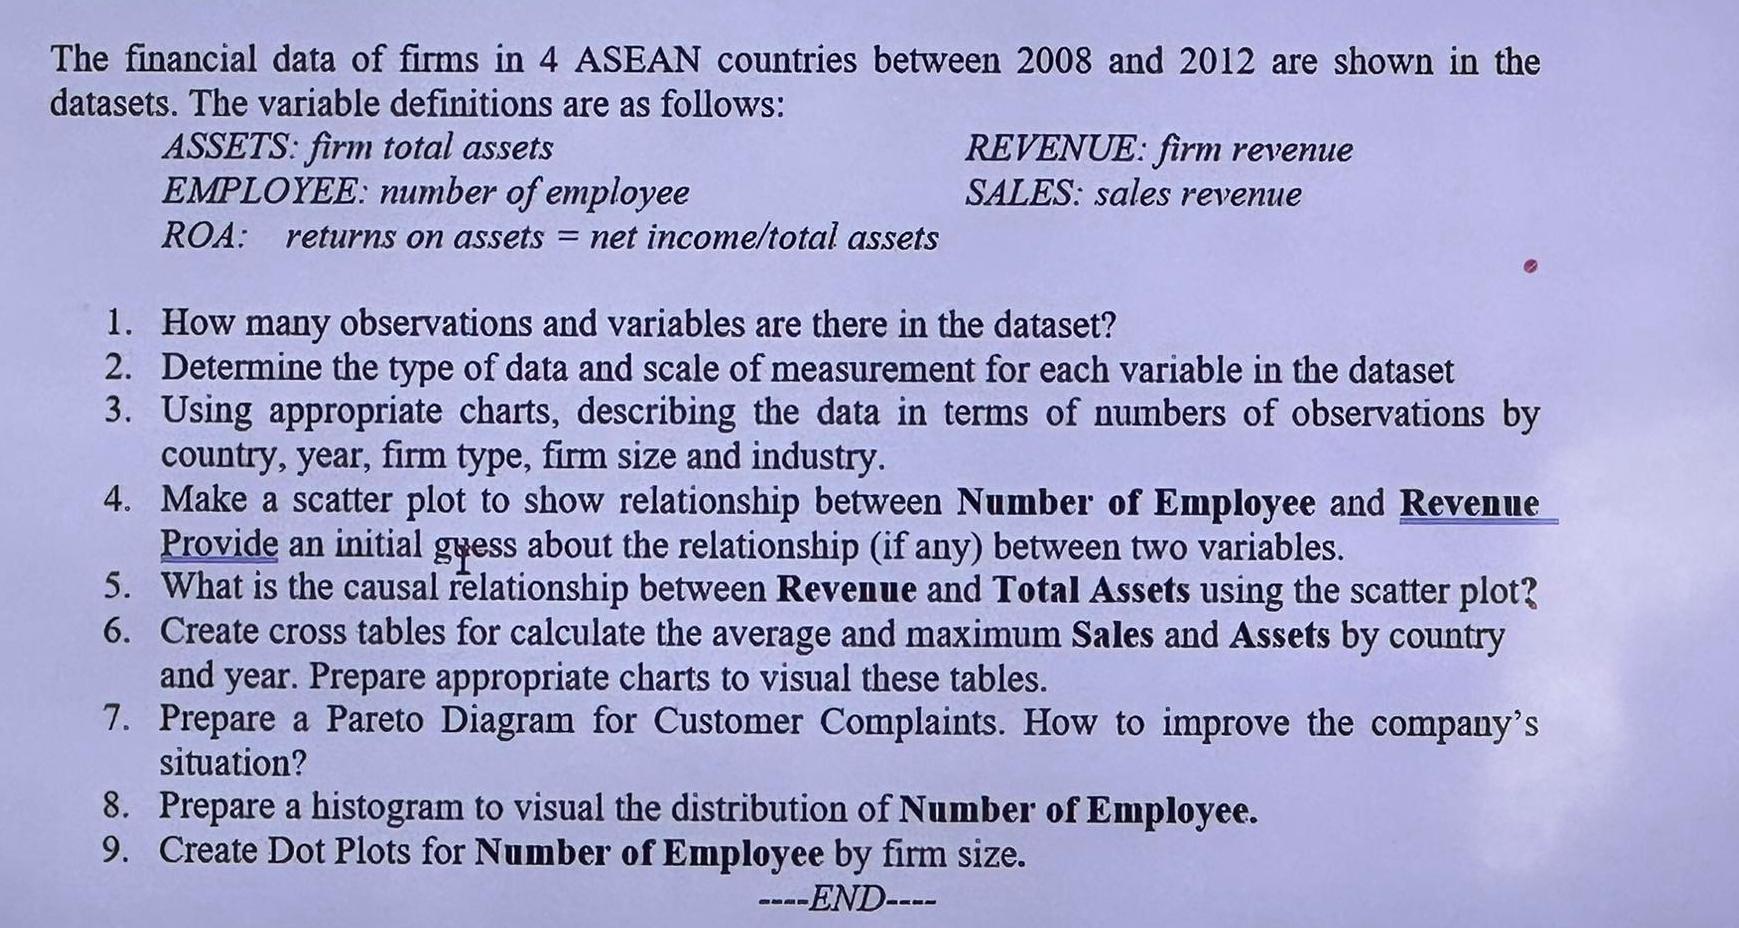
The financial data of firms in 4 ASEAN countries between 2008 and 2012 are shown in the datasets. The variable definitions are as follows:

The financial data of firms in 4 ASEAN countries between 2008 and 2012 are shown in the datasets. The variable definitions are as follows: ASSETS: firm total assets EMPLOYEE: number of employee ROA: returns on assets = net income/total assets REVENUE: firm revenue SALES: sales revenue 1. How many observations and variables are there in the dataset? 2. Determine the type of data and scale of measurement for each variable in the dataset 3. Using appropriate charts, describing the data in terms of numbers of observations by country, year, firm type, firm size and industry. 4. Make a scatter plot to show relationship between Number of Employee and Revenue Provide an initial gress about the relationship (if any) between two variables. 5. What is the causal relationship between Revenue and Total Assets using the scatter plot? 6. Create cross tables for calculate the average and maximum Sales and Assets by country and year. Prepare appropriate charts to visual these tables. 7. Prepare a Pareto Diagram for Customer Complaints. How to improve the company's situation? 8. Prepare a histogram to visual the distribution of Number of Employee. 9. Create Dot Plots for Number of Employee by firm size. --END----
Step by Step Solution
There are 3 Steps involved in it
Step: 1

Get Instant Access to Expert-Tailored Solutions
See step-by-step solutions with expert insights and AI powered tools for academic success
Step: 2

Step: 3

Ace Your Homework with AI
Get the answers you need in no time with our AI-driven, step-by-step assistance
Get Started


