

Question
The Financial Detective, 2016 Financial characteristics of companies vary for many reasons. The two most prominent drivers are industry economics and firm strategy. Each industry
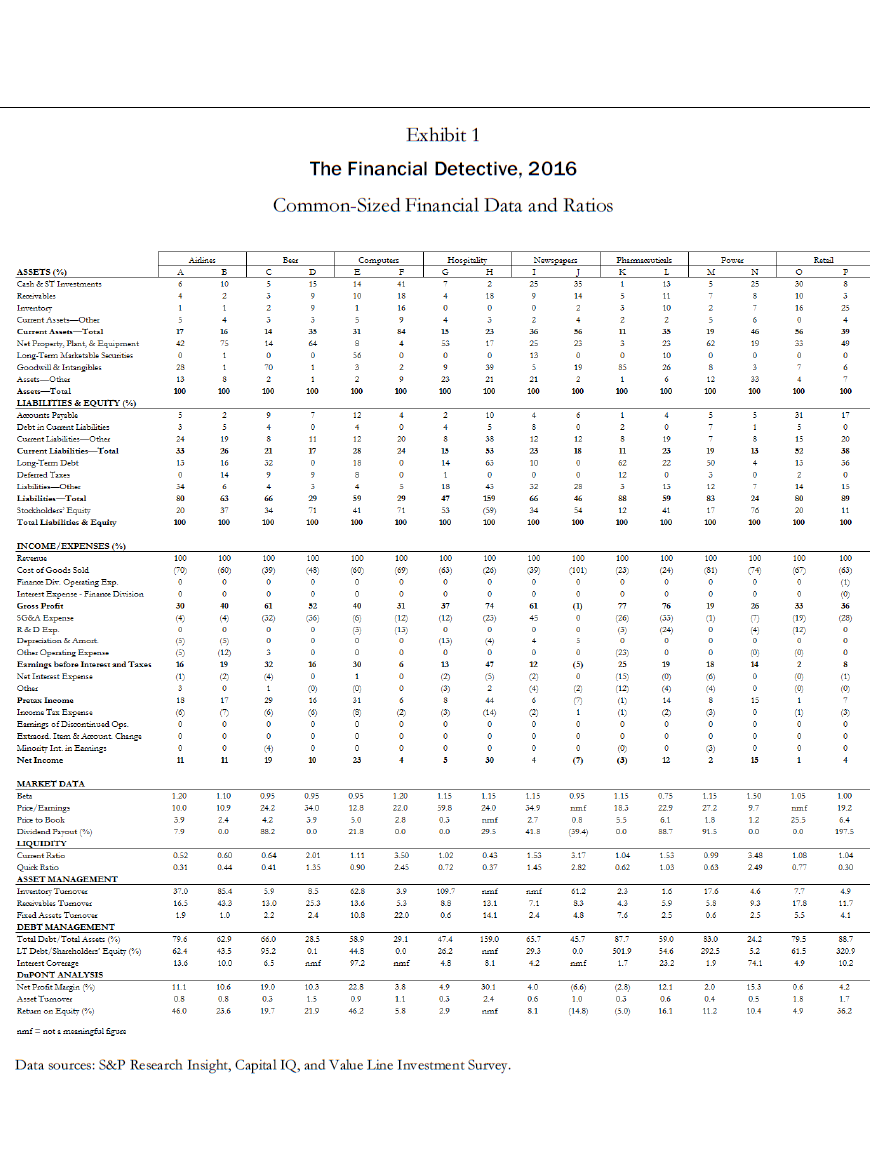
The Financial Detective, 2016
Financial characteristics of companies vary for many reasons. The two most prominent drivers are industry economics and firm strategy.
Each industry has a financial norm around which companies within the industry tend to operate. An airline, for example, would naturally be expected to have a high proportion of fixed assets (airplanes), while a consulting firm would not. A steel manufacturer would be expected to have a lower gross margin than a pharmaceutical manufacturer because commodities such as steel are subject to strong price competition, while highly differentiated products like patented drugs enjoy much more pricing freedom. Because of each industrys unique economic features, average financial statements will vary from one industry to the next.
Similarly, companies within industries have different financial characteristics, in part because of the diverse strategies that can be employed. Executives choose strategies that will position their company favorably in the competitive jockeying within an industry. Strategies typically entail making important choices in how a product is made (e.g., capital intensive versus labor intensive), how it is marketed (e.g., direct sales versus the use of distributors), and how the company is financed (e.g., the use of debt or equity). Strategies among companies in the same industry can differ dramatically. Different strategies can produce striking differences in financial results for firms in the same industry.
The following paragraphs describe pairs of participants in a number of different industries. Their strategies and market niches provide clues as to the financial condition and performance that one would expect of them. The companies common-sized financial statements and operating data, as of early 2016, are presented in a standardized format in Exhibit 1. It is up to you to match the financial data with the company descriptions. Also, try to explain the differences in financial results across industries.
Airlines
Companies A and B are airline companies. One firm is a major airline that flies both domestically and internationally and offers additional services including travel packages and airplane repair. The company owns a refinery to supply its own jet fuel as a hedge to fuel-price volatility. In 2008, this company merged with one of the largest airline carriers in the United States.
The other company operates primarily in the United States, with some routes to the Caribbean and Latin America. It is the leading low-cost carrier in the United States. One source of operating efficiency is the fact that the company carries only three different aircraft in its fleet, making maintenance much simpler than for legacy airlines that might need to service 20 or 30 different aircraft models. This companys growth has been mostly organicit expands its routes by purchasing new aircraft and the rights to fly into new airports.
Your write-up should state which firm from Exhibit #1 corresponds to which firm in the narrative (e.g. For the power industry this might be: Firm#1 = N, Firm#2 = M). You need to provide the reasoning behind your choice. This should point to key ratios and common size statement accounts which you used to make your determination. Be precise in why you selected the data item and how you used it to decide which firm is which. Use whatever sources you please in this analysis. However, you should primarily focus on the data in the case and the information in your textbook. Use the internet/google to help with data in Exhibit #1 that you are unsure of. This shouldnt be a lengthy write-up. Title, write-up, and supporting data should be less than a page.
Step by Step Solution
There are 3 Steps involved in it
Step: 1

Get Instant Access to Expert-Tailored Solutions
See step-by-step solutions with expert insights and AI powered tools for academic success
Step: 2

Step: 3
Ace Your Homework with AI
Get the answers you need in no time with our AI-driven, step-by-step assistance
Get Started
Developments In Entrepreneurial Finance And Technology
Authors: David B. Audretsch, Maksim Belitski, Nada Rejeb, Rosa Caiazza
1st Edition
1800884338,1800884346