Question
The financial information in the Excel file associated with this exercise was obtained from Form 10-K reports for Costco Wholesale Corporation . In this exercise,
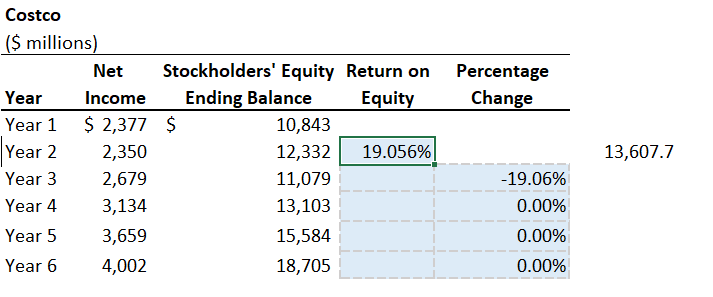
The financial information in the Excel file associated with this exercise was obtained from Form 10-K reports for Costco Wholesale Corporation. In this exercise, we examine how changing the starting point (baseline) of the y-axis from 0.0, impacts the chart that is created. The chart that is created for Costco examines return on equity over a five-year period. The return on equity ratio (Net income/Average stockholders' equity) measures the return of the stockholders' investment in the company. An increase in the ratio generally means that the company is more efficiently using its equity to generate profits.

The answers are not calculated by NI/SE nor by NI/SE (Y1) + SE (Y2) It is also not the average of SE for denominator.
Costco ($ millions) Net Stockholders' Equity Return on Percentage Year Income Ending Balance Equity Change Year 1 $ 2,377 $ 10,843 Year 2 2,350 12,332 19.056% 13,607.7 Year 3 2,679 11,079 -19.06% Year 4 3,134 13,103 0.00% Year 5 3,659 15,584 0.00% Year 6 4,002 18,705 0.00%
Step by Step Solution
3.55 Rating (148 Votes )
There are 3 Steps involved in it
Step: 1
Heres an analysis of how changing the starting point baseline of the yaxis from 00 impacts the chart that is created for Costcos return on equity over ...
Get Instant Access to Expert-Tailored Solutions
See step-by-step solutions with expert insights and AI powered tools for academic success
Step: 2

Step: 3

Ace Your Homework with AI
Get the answers you need in no time with our AI-driven, step-by-step assistance
Get Started


