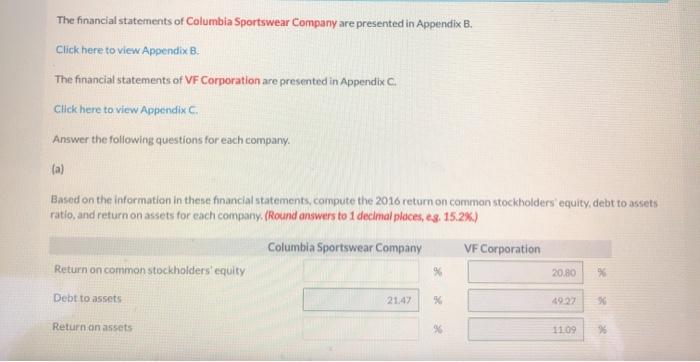
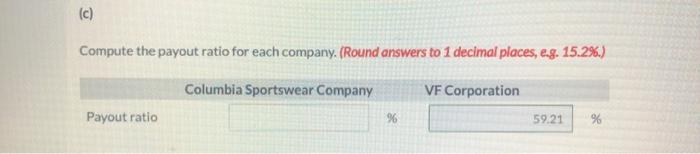
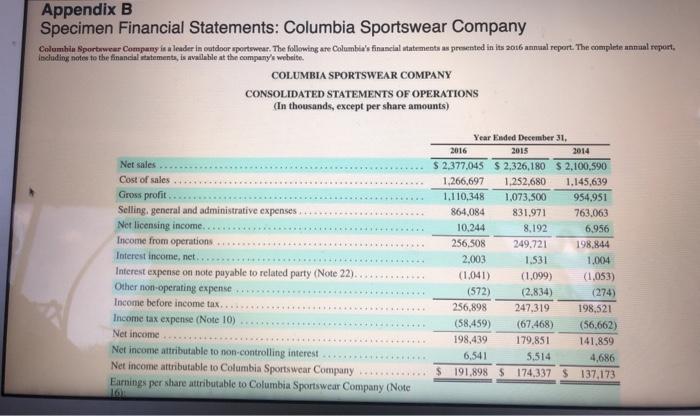
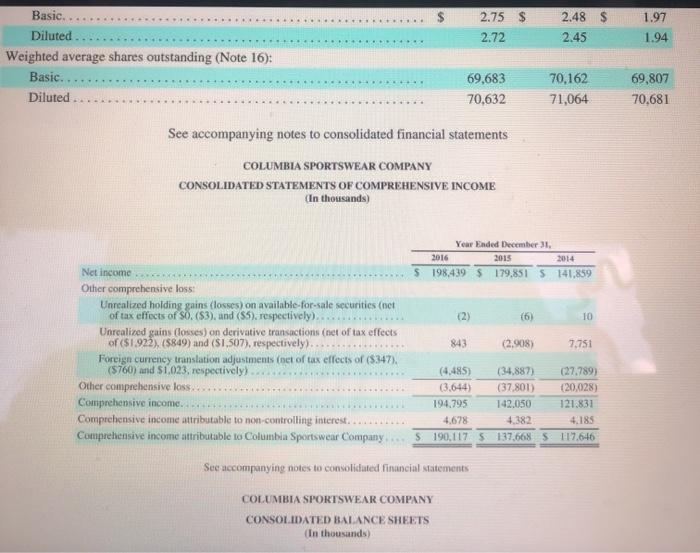
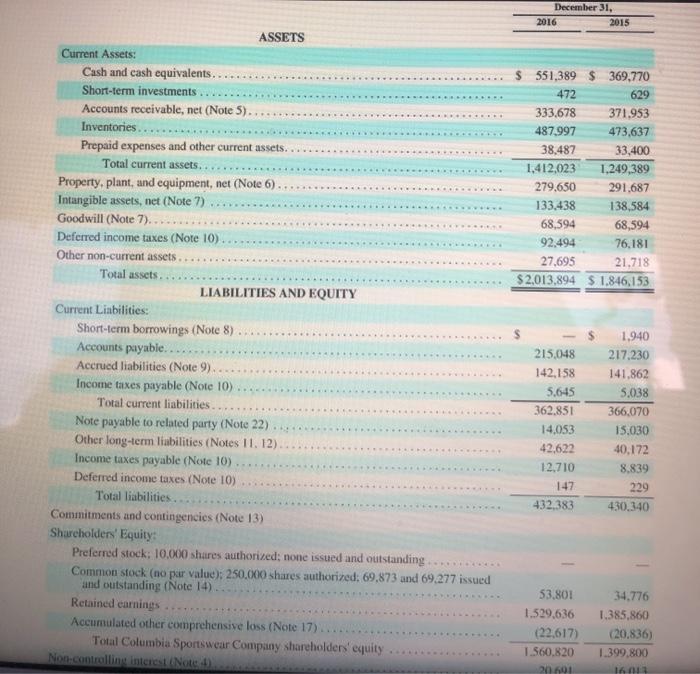
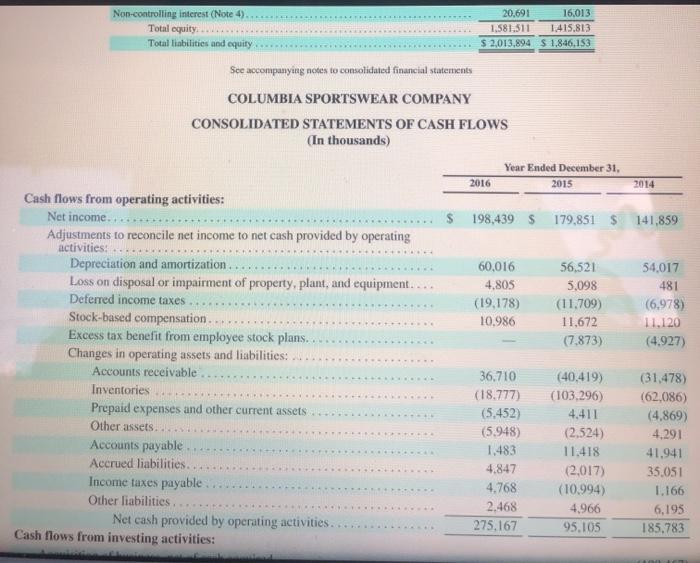
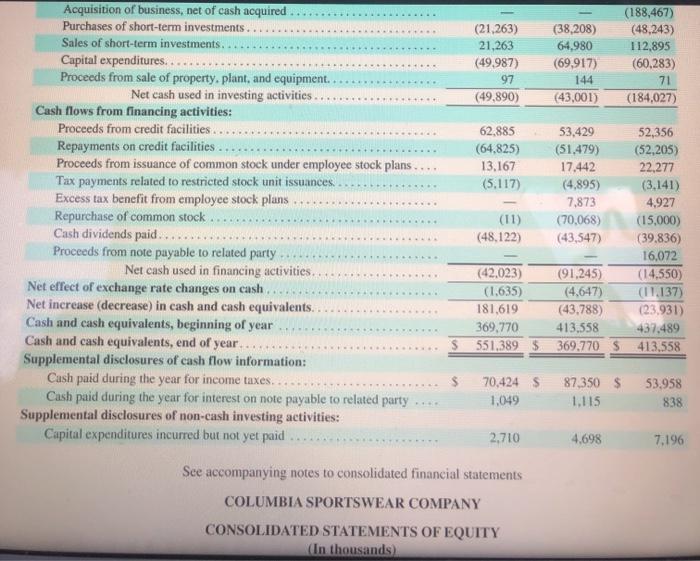
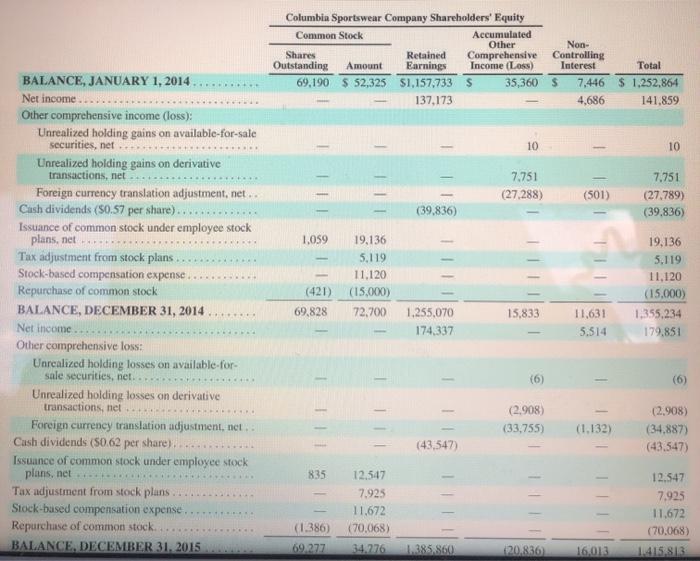
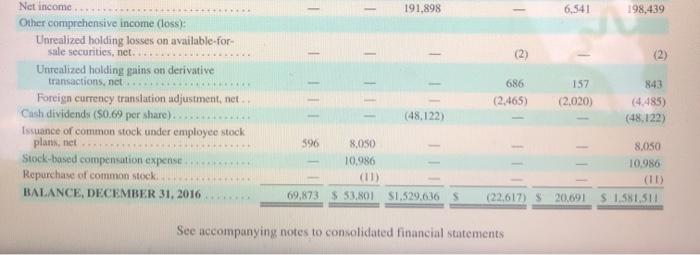
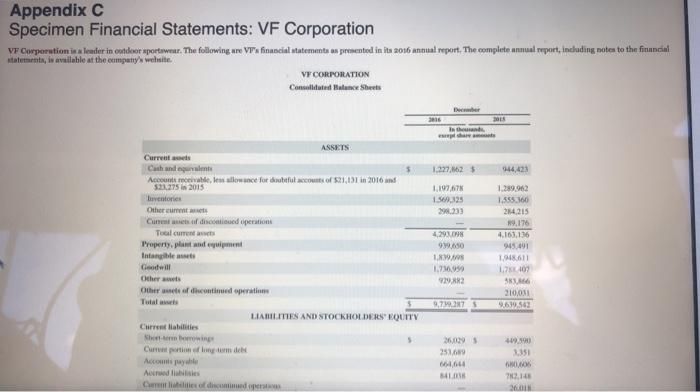
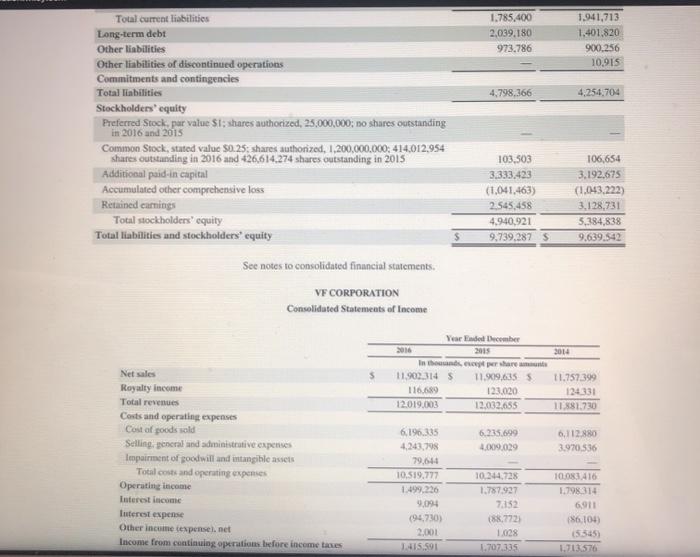
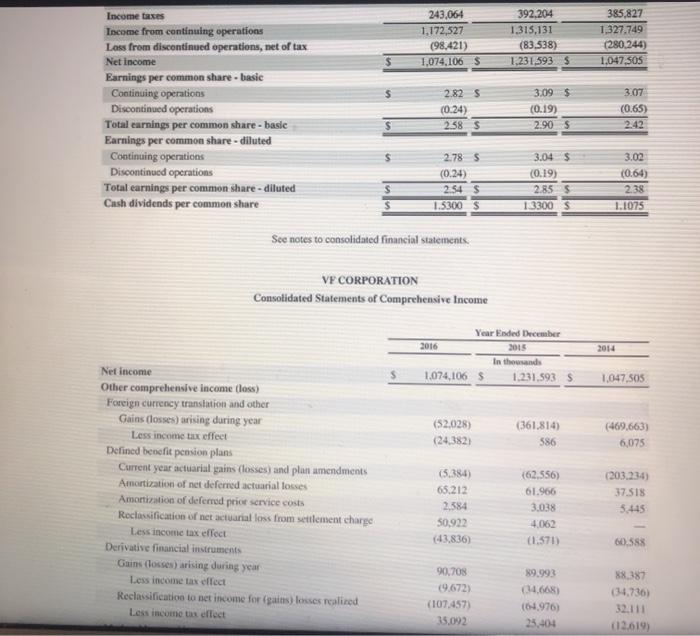
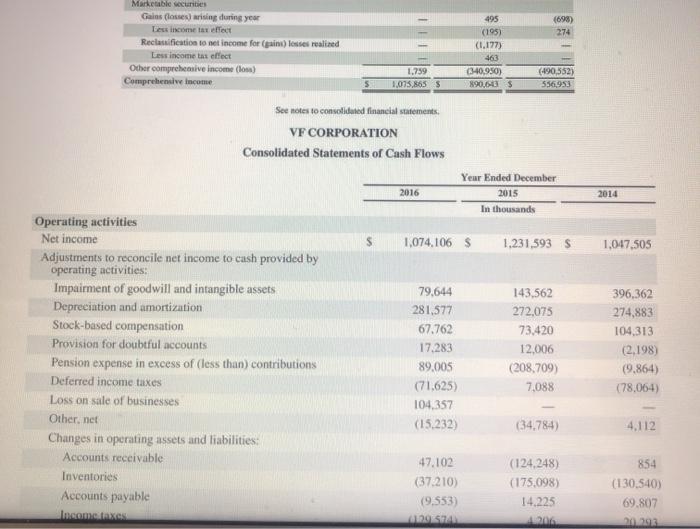
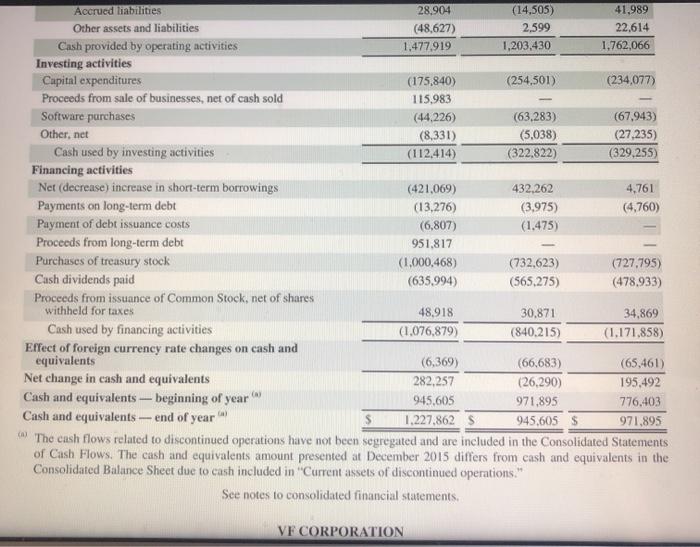
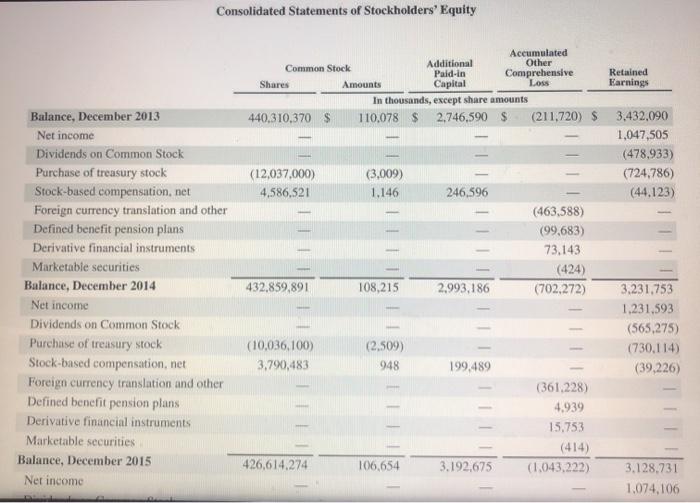
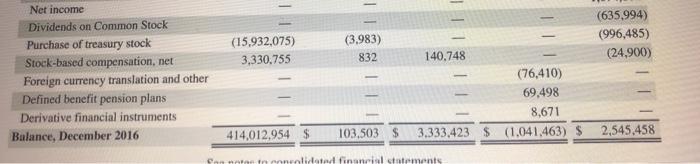
The financial statements of Columbia Sportswear Company are presented in Appendix B. Click here to view Appendix B. The financial statements of VF Corporation are presented in Appendix C. Click here to view Appendix C. Answer the following questions for each company. (a) Based on the information in these financial statements, compute the 2016 return on common stockholders equity, debt to assets ratio, and return on assets for each company. (Round answers to 1 decimal places, es. 15.2%) Columbia Sportswear Company VF Corporation Return on common stockholders equity 20.80 Debt to assets 21:47 49:27 Return on assets 1109 (c) Compute the payout ratio for each company. (Round answers to 1 decimal places, e.g. 15.2%.) Columbia Sportswear Company VF Corporation Payout ratio % 59.21 % including notes to the financial statements, is available at the company's website Appendix B Specimen Financial Statements: Columbia Sportswear Company Columbia Sportswear Company is a leader in catdoor sportswear. The following are Columbia's financial statement as presented in its 2016 annual report. The complete annual report. COLUMBIA SPORTSWEAR COMPANY CONSOLIDATED STATEMENTS OF OPERATIONS (In thousands, except per share amounts) Net sales Cost of sales Gross profit Selling, general and administrative expenses Net licensing income.. Income from operations Interest income, net Interest expense on note puyable to related party (Note 22). Other non-operating expense Income before income tax. Income tax expense (Note 10) Net income Net income attributable to non-controlling interest Net income attributable to Columbia Sportswear Company Earnings per share attributable to Columbia Sportswear Company (Note LOM Year Ended December 31, 2016 2015 2014 $ 2,377.045 $ 2,326,180 $ 2.100,590 1,266,697 1.252.680 1.145,639 1.110,348 1,073,500 954.951 864,084 831.971 763.063 10.244 8.192 6,956 256,508 249.721 198,844 2,003 1.531 1.004 (1.041) (1.099) (1.053) (572) (2.834) (274) 256,898 247,319 198,521 (58,459) (67.468) (56.662) 198,439 179.851 141.859 6,541 5.514 4.686 $191,898 $ 174,337 $ 137,173 2.75 $ 1.97 ... 2.48 $ 2.45 2.72 1.94 Basic, Diluted Weighted average shares outstanding (Note 16): Basic... Diluted 69,683 70,632 70.162 71,064 69,807 70,681 See accompanying notes to consolidated financial statements COLUMBIA SPORTSWEAR COMPANY CONSOLIDATED STATEMENTS OF COMPREHENSIVE INCOME (In thousands Year Ended December 31, 2016 2015 2014 198.439 $ 179.851 S 141.859 S (2) (6) 10 843 (2.908) 7.751 Not income Other comprehensive loss Unrealized holding gains (losses) on available-for-sale securities (net of tax effects of S. (53), and (55), respectively)... Unrealized gains (losses) on derivative transactions (net of tax effects of ($1.922), (8849) and ($1,507), respectively). Foreign currency translation adjustments (net of tux effects of (347) (5760) and $1,023, respectively) Other comprehensive loss Comprehensive income Comprehensive income attributable to non-controlling interest Comprehensive income attributable to Columbia Sportswear Company. (4.485) (34.887) (27.789) (3.644) (37.801 20.028) 194.795 142,050 121.831 4.678 4.382 4.185 190,117 5137,668 5117.646 S See accompanying notes to consolidated financial statements COLUMBIA SPORTSWEAR COMPANY CONSOLIDATED BALANCE SHEETS (In thousands) December 31, 2016 2015 $ 551,389 $ 369.770 472 629 333.678 371,953 487,997 473,637 38,487 33.400 1,412,023 1,249,389 279,650 291,687 133,438 138,584 68,594 68,594 92.494 76.181 27,695 21.718 $2.013.894 $ 1.846,153 ASSETS Current Assets: Cash and cash equivalents.... Short-term investments Accounts receivable, net (Note 5). Inventories... Prepaid expenses and other current assets. Total current assets. Property, plant, and equipment, net (Note 6). Intangible assets, net (Note 7) Goodwill (Note 7). Deferred income taxes (Note 10) Other non-current assets Total assets. LIABILITIES AND EQUITY Current Liabilities: Short-term borrowings (Note 8) Accounts payable. Accrued liabilities (Note 9). Income taxes payable (Note 10) Total current liabilities Note payable to related party (Note 22) Other long-term liabilities (Notes 11.12) Income taxes payable (Note 10) Deferred income taxes (Note 10) Total liabilities. Commitments and contingencies (Note 13) Shareholders' Equity Preferred stock: 10,000 shares authorized: none issued and outstanding Common stock (no par value): 250,000 shares authorized: 69,873 and 69.277 issued and outstanding (Note 14) Retained earnings Accumulated other comprehensive loss (Note 17) Total Columbia Sportswear Company shareholders equity Non controlling interest (Note: 215,048 142,158 5.645 362.851 14.053 42,622 12.710 147 432.383 1.940 217.230 141.862 5.038 366,070 15.030 40,172 8.839 229 430,340 53.801 1.529,636 (22,617) 1.560.820 20.601 34.776 1.385,860 (20.836) 1.399,800 16 Non-controlling interest (Note 4) Totaloquity Total liabilities and equity See accompanying notes to consolidated financial statements 20.691 16,013 1.581.511 1415.813 $ 2,013,894 $1,846,153 COLUMBIA SPORTSWEAR COMPANY CONSOLIDATED STATEMENTS OF CASH FLOWS In thousands) Year Ended December 31, 2015 2016 2014 $ 198,439 $ 179,851 $ 141,859 60,016 4,805 (19,178) 10,986 56,521 5,098 (11.709) 11,672 (7.873) 54,017 481 (6.978) 11.120 (4.927) Cash flows from operating activities: Net income. Adjustments to reconcile net income to net cash provided by operating activities: Depreciation and amortization Loss on disposal or impairment of property, plant, and equipment.... Deferred income taxes Stock-based compensation. Excess tax benefit from employee stock plans. Changes in operating assets and liabilities: Accounts receivable Inventories Prepaid expenses and other current assets Other assets Accounts payable Accrued liabilities Income taxes payable Other liabilities Net cash provided by operating activities. Cash flows from investing activities: 36.710 (18.777) (5.452) (5.948) 1,483 4.847 4.768 2.468 275.167 (40,419) (103,296) 4.411 (2,524) 11.418 (2017) (10.994) 4.966 95.105 (31,478) (62,086) (4.869) 4.291 41.941 35.051 1.166 6,195 185.783 (21,263) 21,263 (49.987) 97 (49,890) (38,208) 64,980 (69.917) 144 (43,001) (188,467) (48,243) 112,895 (60.283) 71 (184,027) Acquisition of business, net of cash acquired Purchases of short-term investments Sales of short-term investments. Capital expenditures... Proceeds from sale of property, plant, and equipment. Net cash used in investing activities Cash flows from financing activities: Proceeds from credit facilities Repayments on credit facilities Proceeds from issuance of common stock under employee stock plans.... Tax payments related to restricted stock unit issuances. Excess tax benefit from employee stock plans Repurchase of common stock Cash dividends paid... Proceeds from note payable to related party Net cash used in financing activities. Net effect of exchange rate changes on cash Net increase (decrease) in cash and cash equivalents. Cash and cash equivalents, beginning of year Cash and cash equivalents, end of year.. Supplemental disclosures of cash flow information: Cash paid during the year for income taxes. Cash paid during the year for interest on note payable to related party Supplemental disclosures of non-cash investing activities: Capital expenditures incurred but not yet paid 62.885 53,429 52,356 (64,825) (51,479) (52,205) 13.167 17,442 22,277 (5,117) (4,895) (3.141) 7,873 4.927 (11) (70,068) (15,000) (48,122) (43,547) (39.836) 16,072 (42.023) (91,245) (14,550) (1.635) (4,647) (11.137) 181,619 (43.788) (23.931) 369.770 413,558 437.489 $ 551,389 $ 369.770 S 413.558 $ 70,424 $ 1,049 87,350 $ 1.115 53.958 838 2.710 4.698 7.196 See accompanying notes to consolidated financial statements COLUMBIA SPORTSWEAR COMPANY CONSOLIDATED STATEMENTS OF EQUITY (In thousands) - - 191.898 -- 6,541 198,439 1 (2) (2) 843 Net income Other comprehensive income (loss): Unrealized holding losses on available for sale securities, net. Unrealized holding gains on derivative transactions, net Foreign currency translation adjustment, net Cash dividends (50.69 per share). Issuance of common stock under employee stock plans, net. Stock-based compensation expense Repurchase of common stock BALANCE, DECEMBER 31, 2016 TIL 686 (2,465) 157 (2.020) (48,122) (4.485) (48,122) 596 8,050 10.986 8.050 10.986 69.873 $ 53.801 SI.529.636 S (22.617) 20.691 S. 1.581.511 See accompanying notes to consolidated financial statements Appendix C Specimen Financial Statements: VF Corporation VF Corporation is a leader in ootdoor sportownur. The following are VT financial statements as presented in its 2016 annual report. The completo annual report, including noten to the financial Matements, is available at the company's website. VF CORPORATION Concilitated Balance Sheets 316 In the 1.227.1625 1.197,67 156.125 29233 ASSETS Current Cash and quite Account cevable, les allowance for tafute of 21,131 in 2016 and 522751 2015 ventories Other current Curso de operations Tool curre Property, plant and in Intangible to Goodwill Other Othere of discontinued operation Total LIABILITIES AND STOCKHOLDERS' EQUITY Chirr Babilities Showing Cum poti fum de Accoylu Andes 4,293.0 99.650 1.99 1.236,059 9292 1.289.962 1.555.160 264.215 9,176 4.161.136 945.491 1.48.611 1.7407 3. 210,031 9,630.542 9,7197 26.09 251,69 409.500 2.351 70.14 M.IN 1.785.400 2,039,180 973.786 1.941,713 1.401.820 900.256 10,915 4,798.366 4.254,704 Total current liabilities Long-term debt Other liabilities Other liabilities of discontinued operations Commitments and contingencies Total liabilities Stockholders' equity Preferred Stock, par value $i; shares authorized, 25,000,000; no shares outstanding in 2016 and 2015 Common Stock, stated value 50:25: shares authorized, 1,200,000.000; 414.012,954 shares outstanding in 2016 and 426,614.274 shares outstanding in 2015 Additional paid-in capital Accumulated other comprehensive loss Retained earnings Total stockholders' equity Total liabilities and stockholders' equity 103,503 3,333,423 (1.041.463) 2.545,458 4,940,921 9,739,287 S 106,654 3.192.675 (1.043.222) 3.128,731 5.384,838 9.639,542 See notes to consolidated financial statements VE CORPORATION Consolidated Statements of income 2014 Year Endedecember 2016 In the share 11.902.314 11.909,6355 116.689 121.020 12.019.003 12.032,655 11.757.399 124331 11881.730 6,196.335 4,243,798 6.735.699 4,0x19,029 6.112.880 3.970,536 Net sales Royalty Income Total revenues Costs and operating expenses Cost of goods sold Selling general and administrative expenses Impairment of poodwill and intangible assets Total costs and operating expenses Operating income Interest income luterest expense Other income expensel.net Income from continuing operations before income taxes 10.519,777 1.499.226 9,094 (94.730) 2.001 115.591 10.344.728 1.787.927 752 188.7723 1.028 1.707.335 10.083 416 1.798 314 6,911 $6.104) 15545) 1.713.576 243,064 1,172,527 (98.421) 1,074,106 $ 392,204 1.315,131 (83.538) 1.231,5935 385.827 1.327.749 (280.244) 1.047,505 Income taxes Income from continuing operations Lass from discontinued operations, net of tax Net Income Earnings per common share - basic Continuing operations Discontinued operations Total earnings per common share - basie Earnings per common share - diluted Continuing operations Discontinued operations Totul earnings per common share-diluted Cash dividends per common share 2.82 s (0.24) 2.58 5 3.09 $ (0.19) 2.905 3.07 (0.65) 2.42 2.78 (0.24) 2.54 $ 1.5300 $ 3.04 $ (0.19) 2.85 S 13300 $ 3.02 (0.64) 238 1.1075 See notes to consolidated financial statements VE CORPORATION Consolidated Statements of Comprehensive Income 2014 Year Ended December 2016 2015 In the sand 1.074,1065 1.231,5935 1,047.505 (52.028) (24,3821 (361.814) 586 (469,663) 6,075 Net Income Other comprehensive income loss) Foreign currency translation and other Gains (losses) arising during year Less income tax effect Defined benefit pension plans Current year actuarial gains (losses and plan amendments Amortization of net deferred actuarial losses Amortization of deferred prior service costs Reclassification of net actuarial loss from settlement charge Less income tax effect Derivative financial instruments Gains (losses) arising during your Less income tax effect Reclassification to set income for (gains) losses realized Less income in effect (5.384) 65.212 2.384 50,922 (43.836) (62.556 61.966 3.038 4.062 (1.571) (203.234) 37.518 3.445 60.588 90,708 9.672) (107,457) 15.092 89.993 (14.668) (64.976) 25,404 88,387 (34.736) 32.111 (12.619 (698) 274 Marketable securities Gains (losses) arising during year Les income tax effect Reclassification to net income for (gain) losses realized Less income tax effect Other comprehensive income (los) Comprehensive Income 495 (195) (1.177) 463 (340.950) 89093 S 1,259 1.075,8653 (490,552) 556953 See notes to consolidated financial statements. VF CORPORATION Consolidated Statements of Cash Flows 2016 Year Ended December 2015 In thousands 2014 1,074,106 $ 1.231,593 $ 1,047.505 Operating activities Net income Adjustments to reconcile net income to cash provided by operating activities: Impaiment of goodwill and intangible assets Depreciation and amortization Stock-based compensation Provision for doubtful accounts Pension expense in excess of (less than contributions Deferred income taxes Loss on sale of businesses Other, net Changes in operating assets and liabilities: Accounts receivable Inventories Accounts payable Income taxes 79,644 281,577 67.762 17.283 89.005 (71.625) 104,357 (15.232) 143,562 272,075 73.420 12,006 (208,709) 7,088 396,362 274,883 104,313 (2.198) (9,864) (78,064) (34,784) 4,112 47.102 (37210) (9.553) 129S (124.248) (175,098) 14.225 200 854 (130,540) 69.807 20.293 Accrued liabilities 28.904 (14,505) 41,989 Other assets and liabilities (48,627) 2.599 22.614 Cash provided by operating activities 1.477.919 1,203,430 1.762,066 Investing activities Cupital expenditures (175,840) (254,501) (234,077) Proceeds from sale of businesses, net of cash sold 115.983 Software purchases (44,226) (63.283) (67,943) Other, net (8,331) (5,038) (27,235) Cash used by investing activities (112,414) (322.822) (329,255) Financing activities Net (decrease increase in short-term borrowings (421,069) 432,262 4,761 Payments on long-term debt (13,276) (3.975) (4,760) Payment of debt issuance costs (6,807) (1,475) Proceeds from long-term debt 951,817 Purchases of treasury stock (1,000,468) (732,623) (727.795) Cash dividends paid (635,994) (565,275) (478.933) Proceeds from issuance of Common Stock, net of shares withheld for taxes 48,918 30,871 34,869 Cash used by financing activities (1.076,879) (840,215) (1.171,858) Effect of foreign currency rate changes on cash and equivalents (6,369) (66,683) (65,461) Net change in cash and equivalents 282,257 (26.290) 195,492 Cash and equivalents - beginning of year 945,605 971,895 776,403 Cash and equivalents -- end of year $ 1.227,862 S 945,605 $ 971.895 kW. The cash flows related to discontinued operations have not been segregated and are included in the Consolidated Statements of Cash Flows. The cash and equivalents amount presented at December 2015 differs from cash and equivalents in the Consolidated Balance Sheet due to cash included in "Current assets of discontinued operations." See notes to consolidated financial statements VF CORPORATION Consolidated Statements of Stockholders' Equity IIIIII Balance, December 2013 Net income Dividends on Common Stock Purchase of treasury stock Stock-based compensation, net Foreign currency translation and other Defined benefit pension plans Derivative financial instruments Marketable securities Balance, December 2014 Net income Dividends on Common Stock Purchase of treasury stock Stock-based compensation, net Foreign currency translation and other Defined benefit pension plans Derivative financial instruments Marketable securities Balance, December 2015 Net income Accumulated Common Stock Additional Other Paid in Comprehensive Retained Shares Amounts Capital Loss Earnings In thousands, except share amounts 440,310,370 $ 110,078 $ 2,746,590 $ (211.720) $ 3.432.090 1,047,505 (478,933) (12,037.000) (3,009) (724,786) 4,586,521 1.146 246,596 (44,123) (463,588) (99,683) 73.143 (424) 432,859,891 108,215 2,993,186 (702.272) 3.231,753 1.231,593 (565,275) (10,036,100) (2,509) (730,114) 3.790,483 948 199,489 (39,226) (361,228) 4.939 15.753 (414) 426,614.274 106,654 3.192,675 (1.043.222) 3.128.731 1,074,106 111 (15,932,075) 3,330.755 (3.983) 832 (635.994) (996,485) (24,900) Net income Dividends on Common Stock Purchase of treasury stock Stock-based compensation, net Foreign currency translation and other Defined benefit pension plans Derivative financial instruments Balance, December 2016 140.748 (76,410) 69,498 8,671 3,333,423 $ (1.041.463) $ 414.012,954 $ 103,503 $ 2.545.458 Can nota in conrntidad financial statements The financial statements of Columbia Sportswear Company are presented in Appendix B. Click here to view Appendix B. The financial statements of VF Corporation are presented in Appendix C. Click here to view Appendix C. Answer the following questions for each company. (a) Based on the information in these financial statements, compute the 2016 return on common stockholders equity, debt to assets ratio, and return on assets for each company. (Round answers to 1 decimal places, es. 15.2%) Columbia Sportswear Company VF Corporation Return on common stockholders equity 20.80 Debt to assets 21:47 49:27 Return on assets 1109 (c) Compute the payout ratio for each company. (Round answers to 1 decimal places, e.g. 15.2%.) Columbia Sportswear Company VF Corporation Payout ratio % 59.21 % including notes to the financial statements, is available at the company's website Appendix B Specimen Financial Statements: Columbia Sportswear Company Columbia Sportswear Company is a leader in catdoor sportswear. The following are Columbia's financial statement as presented in its 2016 annual report. The complete annual report. COLUMBIA SPORTSWEAR COMPANY CONSOLIDATED STATEMENTS OF OPERATIONS (In thousands, except per share amounts) Net sales Cost of sales Gross profit Selling, general and administrative expenses Net licensing income.. Income from operations Interest income, net Interest expense on note puyable to related party (Note 22). Other non-operating expense Income before income tax. Income tax expense (Note 10) Net income Net income attributable to non-controlling interest Net income attributable to Columbia Sportswear Company Earnings per share attributable to Columbia Sportswear Company (Note LOM Year Ended December 31, 2016 2015 2014 $ 2,377.045 $ 2,326,180 $ 2.100,590 1,266,697 1.252.680 1.145,639 1.110,348 1,073,500 954.951 864,084 831.971 763.063 10.244 8.192 6,956 256,508 249.721 198,844 2,003 1.531 1.004 (1.041) (1.099) (1.053) (572) (2.834) (274) 256,898 247,319 198,521 (58,459) (67.468) (56.662) 198,439 179.851 141.859 6,541 5.514 4.686 $191,898 $ 174,337 $ 137,173 2.75 $ 1.97 ... 2.48 $ 2.45 2.72 1.94 Basic, Diluted Weighted average shares outstanding (Note 16): Basic... Diluted 69,683 70,632 70.162 71,064 69,807 70,681 See accompanying notes to consolidated financial statements COLUMBIA SPORTSWEAR COMPANY CONSOLIDATED STATEMENTS OF COMPREHENSIVE INCOME (In thousands Year Ended December 31, 2016 2015 2014 198.439 $ 179.851 S 141.859 S (2) (6) 10 843 (2.908) 7.751 Not income Other comprehensive loss Unrealized holding gains (losses) on available-for-sale securities (net of tax effects of S. (53), and (55), respectively)... Unrealized gains (losses) on derivative transactions (net of tax effects of ($1.922), (8849) and ($1,507), respectively). Foreign currency translation adjustments (net of tux effects of (347) (5760) and $1,023, respectively) Other comprehensive loss Comprehensive income Comprehensive income attributable to non-controlling interest Comprehensive income attributable to Columbia Sportswear Company. (4.485) (34.887) (27.789) (3.644) (37.801 20.028) 194.795 142,050 121.831 4.678 4.382 4.185 190,117 5137,668 5117.646 S See accompanying notes to consolidated financial statements COLUMBIA SPORTSWEAR COMPANY CONSOLIDATED BALANCE SHEETS (In thousands) December 31, 2016 2015 $ 551,389 $ 369.770 472 629 333.678 371,953 487,997 473,637 38,487 33.400 1,412,023 1,249,389 279,650 291,687 133,438 138,584 68,594 68,594 92.494 76.181 27,695 21.718 $2.013.894 $ 1.846,153 ASSETS Current Assets: Cash and cash equivalents.... Short-term investments Accounts receivable, net (Note 5). Inventories... Prepaid expenses and other current assets. Total current assets. Property, plant, and equipment, net (Note 6). Intangible assets, net (Note 7) Goodwill (Note 7). Deferred income taxes (Note 10) Other non-current assets Total assets. LIABILITIES AND EQUITY Current Liabilities: Short-term borrowings (Note 8) Accounts payable. Accrued liabilities (Note 9). Income taxes payable (Note 10) Total current liabilities Note payable to related party (Note 22) Other long-term liabilities (Notes 11.12) Income taxes payable (Note 10) Deferred income taxes (Note 10) Total liabilities. Commitments and contingencies (Note 13) Shareholders' Equity Preferred stock: 10,000 shares authorized: none issued and outstanding Common stock (no par value): 250,000 shares authorized: 69,873 and 69.277 issued and outstanding (Note 14) Retained earnings Accumulated other comprehensive loss (Note 17) Total Columbia Sportswear Company shareholders equity Non controlling interest (Note: 215,048 142,158 5.645 362.851 14.053 42,622 12.710 147 432.383 1.940 217.230 141.862 5.038 366,070 15.030 40,172 8.839 229 430,340 53.801 1.529,636 (22,617) 1.560.820 20.601 34.776 1.385,860 (20.836) 1.399,800 16 Non-controlling interest (Note 4) Totaloquity Total liabilities and equity See accompanying notes to consolidated financial statements 20.691 16,013 1.581.511 1415.813 $ 2,013,894 $1,846,153 COLUMBIA SPORTSWEAR COMPANY CONSOLIDATED STATEMENTS OF CASH FLOWS In thousands) Year Ended December 31, 2015 2016 2014 $ 198,439 $ 179,851 $ 141,859 60,016 4,805 (19,178) 10,986 56,521 5,098 (11.709) 11,672 (7.873) 54,017 481 (6.978) 11.120 (4.927) Cash flows from operating activities: Net income. Adjustments to reconcile net income to net cash provided by operating activities: Depreciation and amortization Loss on disposal or impairment of property, plant, and equipment.... Deferred income taxes Stock-based compensation. Excess tax benefit from employee stock plans. Changes in operating assets and liabilities: Accounts receivable Inventories Prepaid expenses and other current assets Other assets Accounts payable Accrued liabilities Income taxes payable Other liabilities Net cash provided by operating activities. Cash flows from investing activities: 36.710 (18.777) (5.452) (5.948) 1,483 4.847 4.768 2.468 275.167 (40,419) (103,296) 4.411 (2,524) 11.418 (2017) (10.994) 4.966 95.105 (31,478) (62,086) (4.869) 4.291 41.941 35.051 1.166 6,195 185.783 (21,263) 21,263 (49.987) 97 (49,890) (38,208) 64,980 (69.917) 144 (43,001) (188,467) (48,243) 112,895 (60.283) 71 (184,027) Acquisition of business, net of cash acquired Purchases of short-term investments Sales of short-term investments. Capital expenditures... Proceeds from sale of property, plant, and equipment. Net cash used in investing activities Cash flows from financing activities: Proceeds from credit facilities Repayments on credit facilities Proceeds from issuance of common stock under employee stock plans.... Tax payments related to restricted stock unit issuances. Excess tax benefit from employee stock plans Repurchase of common stock Cash dividends paid... Proceeds from note payable to related party Net cash used in financing activities. Net effect of exchange rate changes on cash Net increase (decrease) in cash and cash equivalents. Cash and cash equivalents, beginning of year Cash and cash equivalents, end of year.. Supplemental disclosures of cash flow information: Cash paid during the year for income taxes. Cash paid during the year for interest on note payable to related party Supplemental disclosures of non-cash investing activities: Capital expenditures incurred but not yet paid 62.885 53,429 52,356 (64,825) (51,479) (52,205) 13.167 17,442 22,277 (5,117) (4,895) (3.141) 7,873 4.927 (11) (70,068) (15,000) (48,122) (43,547) (39.836) 16,072 (42.023) (91,245) (14,550) (1.635) (4,647) (11.137) 181,619 (43.788) (23.931) 369.770 413,558 437.489 $ 551,389 $ 369.770 S 413.558 $ 70,424 $ 1,049 87,350 $ 1.115 53.958 838 2.710 4.698 7.196 See accompanying notes to consolidated financial statements COLUMBIA SPORTSWEAR COMPANY CONSOLIDATED STATEMENTS OF EQUITY (In thousands) - - 191.898 -- 6,541 198,439 1 (2) (2) 843 Net income Other comprehensive income (loss): Unrealized holding losses on available for sale securities, net. Unrealized holding gains on derivative transactions, net Foreign currency translation adjustment, net Cash dividends (50.69 per share). Issuance of common stock under employee stock plans, net. Stock-based compensation expense Repurchase of common stock BALANCE, DECEMBER 31, 2016 TIL 686 (2,465) 157 (2.020) (48,122) (4.485) (48,122) 596 8,050 10.986 8.050 10.986 69.873 $ 53.801 SI.529.636 S (22.617) 20.691 S. 1.581.511 See accompanying notes to consolidated financial statements Appendix C Specimen Financial Statements: VF Corporation VF Corporation is a leader in ootdoor sportownur. The following are VT financial statements as presented in its 2016 annual report. The completo annual report, including noten to the financial Matements, is available at the company's website. VF CORPORATION Concilitated Balance Sheets 316 In the 1.227.1625 1.197,67 156.125 29233 ASSETS Current Cash and quite Account cevable, les allowance for tafute of 21,131 in 2016 and 522751 2015 ventories Other current Curso de operations Tool curre Property, plant and in Intangible to Goodwill Other Othere of discontinued operation Total LIABILITIES AND STOCKHOLDERS' EQUITY Chirr Babilities Showing Cum poti fum de Accoylu Andes 4,293.0 99.650 1.99 1.236,059 9292 1.289.962 1.555.160 264.215 9,176 4.161.136 945.491 1.48.611 1.7407 3. 210,031 9,630.542 9,7197 26.09 251,69 409.500 2.351 70.14 M.IN 1.785.400 2,039,180 973.786 1.941,713 1.401.820 900.256 10,915 4,798.366 4.254,704 Total current liabilities Long-term debt Other liabilities Other liabilities of discontinued operations Commitments and contingencies Total liabilities Stockholders' equity Preferred Stock, par value $i; shares authorized, 25,000,000; no shares outstanding in 2016 and 2015 Common Stock, stated value 50:25: shares authorized, 1,200,000.000; 414.012,954 shares outstanding in 2016 and 426,614.274 shares outstanding in 2015 Additional paid-in capital Accumulated other comprehensive loss Retained earnings Total stockholders' equity Total liabilities and stockholders' equity 103,503 3,333,423 (1.041.463) 2.545,458 4,940,921 9,739,287 S 106,654 3.192.675 (1.043.222) 3.128,731 5.384,838 9.639,542 See notes to consolidated financial statements VE CORPORATION Consolidated Statements of income 2014 Year Endedecember 2016 In the share 11.902.314 11.909,6355 116.689 121.020 12.019.003 12.032,655 11.757.399 124331 11881.730 6,196.335 4,243,798 6.735.699 4,0x19,029 6.112.880 3.970,536 Net sales Royalty Income Total revenues Costs and operating expenses Cost of goods sold Selling general and administrative expenses Impairment of poodwill and intangible assets Total costs and operating expenses Operating income Interest income luterest expense Other income expensel.net Income from continuing operations before income taxes 10.519,777 1.499.226 9,094 (94.730) 2.001 115.591 10.344.728 1.787.927 752 188.7723 1.028 1.707.335 10.083 416 1.798 314 6,911 $6.104) 15545) 1.713.576 243,064 1,172,527 (98.421) 1,074,106 $ 392,204 1.315,131 (83.538) 1.231,5935 385.827 1.327.749 (280.244) 1.047,505 Income taxes Income from continuing operations Lass from discontinued operations, net of tax Net Income Earnings per common share - basic Continuing operations Discontinued operations Total earnings per common share - basie Earnings per common share - diluted Continuing operations Discontinued operations Totul earnings per common share-diluted Cash dividends per common share 2.82 s (0.24) 2.58 5 3.09 $ (0.19) 2.905 3.07 (0.65) 2.42 2.78 (0.24) 2.54 $ 1.5300 $ 3.04 $ (0.19) 2.85 S 13300 $ 3.02 (0.64) 238 1.1075 See notes to consolidated financial statements VE CORPORATION Consolidated Statements of Comprehensive Income 2014 Year Ended December 2016 2015 In the sand 1.074,1065 1.231,5935 1,047.505 (52.028) (24,3821 (361.814) 586 (469,663) 6,075 Net Income Other comprehensive income loss) Foreign currency translation and other Gains (losses) arising during year Less income tax effect Defined benefit pension plans Current year actuarial gains (losses and plan amendments Amortization of net deferred actuarial losses Amortization of deferred prior service costs Reclassification of net actuarial loss from settlement charge Less income tax effect Derivative financial instruments Gains (losses) arising during your Less income tax effect Reclassification to set income for (gains) losses realized Less income in effect (5.384) 65.212 2.384 50,922 (43.836) (62.556 61.966 3.038 4.062 (1.571) (203.234) 37.518 3.445 60.588 90,708 9.672) (107,457) 15.092 89.993 (14.668) (64.976) 25,404 88,387 (34.736) 32.111 (12.619 (698) 274 Marketable securities Gains (losses) arising during year Les income tax effect Reclassification to net income for (gain) losses realized Less income tax effect Other comprehensive income (los) Comprehensive Income 495 (195) (1.177) 463 (340.950) 89093 S 1,259 1.075,8653 (490,552) 556953 See notes to consolidated financial statements. VF CORPORATION Consolidated Statements of Cash Flows 2016 Year Ended December 2015 In thousands 2014 1,074,106 $ 1.231,593 $ 1,047.505 Operating activities Net income Adjustments to reconcile net income to cash provided by operating activities: Impaiment of goodwill and intangible assets Depreciation and amortization Stock-based compensation Provision for doubtful accounts Pension expense in excess of (less than contributions Deferred income taxes Loss on sale of businesses Other, net Changes in operating assets and liabilities: Accounts receivable Inventories Accounts payable Income taxes 79,644 281,577 67.762 17.283 89.005 (71.625) 104,357 (15.232) 143,562 272,075 73.420 12,006 (208,709) 7,088 396,362 274,883 104,313 (2.198) (9,864) (78,064) (34,784) 4,112 47.102 (37210) (9.553) 129S (124.248) (175,098) 14.225 200 854 (130,540) 69.807 20.293 Accrued liabilities 28.904 (14,505) 41,989 Other assets and liabilities (48,627) 2.599 22.614 Cash provided by operating activities 1.477.919 1,203,430 1.762,066 Investing activities Cupital expenditures (175,840) (254,501) (234,077) Proceeds from sale of businesses, net of cash sold 115.983 Software purchases (44,226) (63.283) (67,943) Other, net (8,331) (5,038) (27,235) Cash used by investing activities (112,414) (322.822) (329,255) Financing activities Net (decrease increase in short-term borrowings (421,069) 432,262 4,761 Payments on long-term debt (13,276) (3.975) (4,760) Payment of debt issuance costs (6,807) (1,475) Proceeds from long-term debt 951,817 Purchases of treasury stock (1,000,468) (732,623) (727.795) Cash dividends paid (635,994) (565,275) (478.933) Proceeds from issuance of Common Stock, net of shares withheld for taxes 48,918 30,871 34,869 Cash used by financing activities (1.076,879) (840,215) (1.171,858) Effect of foreign currency rate changes on cash and equivalents (6,369) (66,683) (65,461) Net change in cash and equivalents 282,257 (26.290) 195,492 Cash and equivalents - beginning of year 945,605 971,895 776,403 Cash and equivalents -- end of year $ 1.227,862 S 945,605 $ 971.895 kW. The cash flows related to discontinued operations have not been segregated and are included in the Consolidated Statements of Cash Flows. The cash and equivalents amount presented at December 2015 differs from cash and equivalents in the Consolidated Balance Sheet due to cash included in "Current assets of discontinued operations." See notes to consolidated financial statements VF CORPORATION Consolidated Statements of Stockholders' Equity IIIIII Balance, December 2013 Net income Dividends on Common Stock Purchase of treasury stock Stock-based compensation, net Foreign currency translation and other Defined benefit pension plans Derivative financial instruments Marketable securities Balance, December 2014 Net income Dividends on Common Stock Purchase of treasury stock Stock-based compensation, net Foreign currency translation and other Defined benefit pension plans Derivative financial instruments Marketable securities Balance, December 2015 Net income Accumulated Common Stock Additional Other Paid in Comprehensive Retained Shares Amounts Capital Loss Earnings In thousands, except share amounts 440,310,370 $ 110,078 $ 2,746,590 $ (211.720) $ 3.432.090 1,047,505 (478,933) (12,037.000) (3,009) (724,786) 4,586,521 1.146 246,596 (44,123) (463,588) (99,683) 73.143 (424) 432,859,891 108,215 2,993,186 (702.272) 3.231,753 1.231,593 (565,275) (10,036,100) (2,509) (730,114) 3.790,483 948 199,489 (39,226) (361,228) 4.939 15.753 (414) 426,614.274 106,654 3.192,675 (1.043.222) 3.128.731 1,074,106 111 (15,932,075) 3,330.755 (3.983) 832 (635.994) (996,485) (24,900) Net income Dividends on Common Stock Purchase of treasury stock Stock-based compensation, net Foreign currency translation and other Defined benefit pension plans Derivative financial instruments Balance, December 2016 140.748 (76,410) 69,498 8,671 3,333,423 $ (1.041.463) $ 414.012,954 $ 103,503 $ 2.545.458 Can nota in conrntidad financial statements