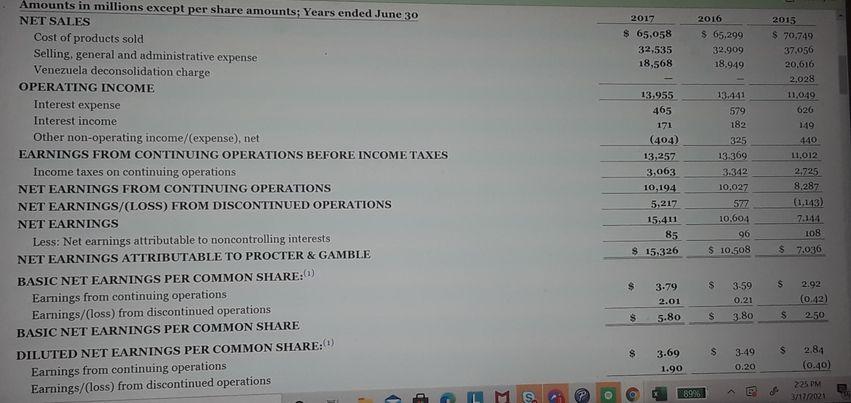
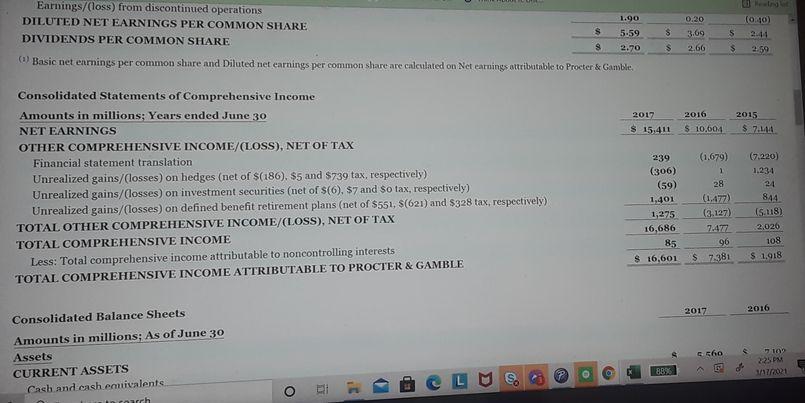
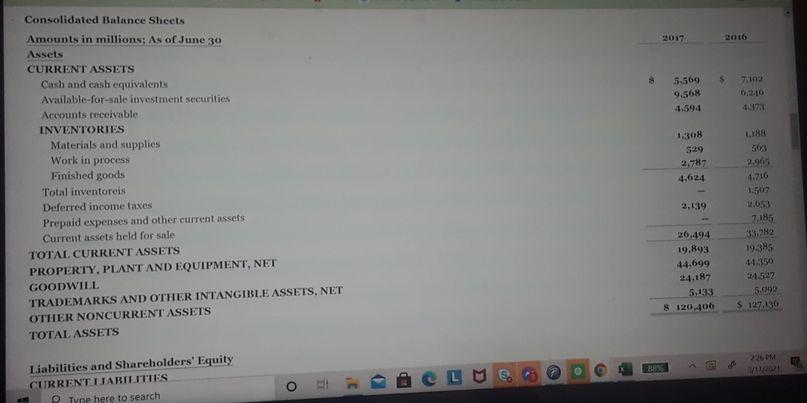
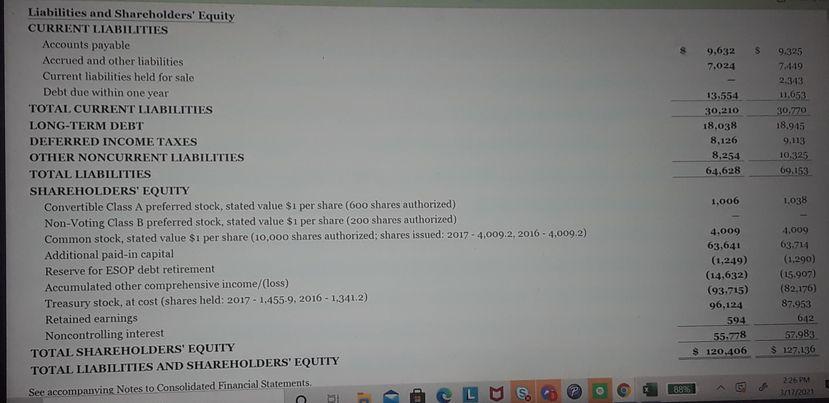
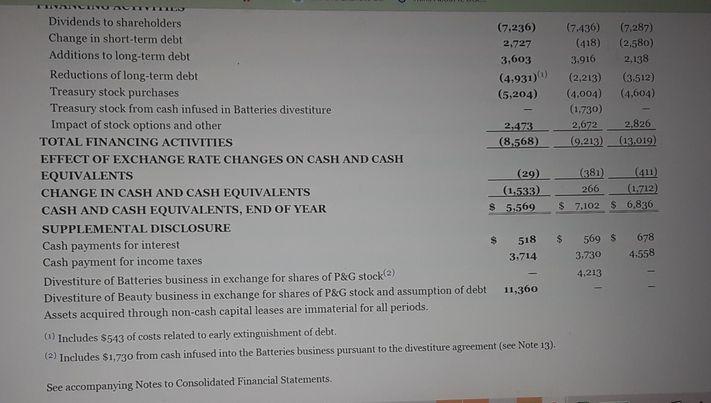
The financial statements of this company are presented in the pictures. The companys complete annual report, including the notes to the financial statements, is available online. Refer to the financial statements and accompanying notes to answer the following questions:
Under the companys stock-based compensation plan, stock options are granted annually to key managers and directors. (1) How many options were granted during 2017 under the plan?
| Options granted during 2017 | | |
(2) How many options were exercisable at June 30, 2017?
| Options exerciseable at June 30, 2017 | | |
(3) How many options were exercised in 2017, and what was the average price of those exercised? (Round average price to 2 decimal places, e.g. 15.25.)
| Options exercised in 2017 | | |
| Average price | | $ |
(4) What is the total stock-based compensation expense for stock options and the total compensation expense for restricted stock, restricted stock units (RSUs), and performance stock units (PSUs) for 2017, 2016, and 2015?
| | | 2017 | | 2016 | | 2015 |
| Total stock-based compensation expense | | $ | | $ | | $ |
| Total compensation expense | | $ | | $ | | $ |
(5) To what accounts are the proceeds from these option exercises credited?
| Option exercises credited | | Bonds PayableCommon Stock and Additional Paid-in CapitalPaid-in-capital in Excess of ParCommon StockDiscount on Bonds PayableCash |
(6) What was the number of outstanding options at June 30, 2017, and at what average exercise price? (Round average price to 2 decimal places, e.g. 15.25.)
| Number of outstanding options | | |
| Average exercise price | | $ |
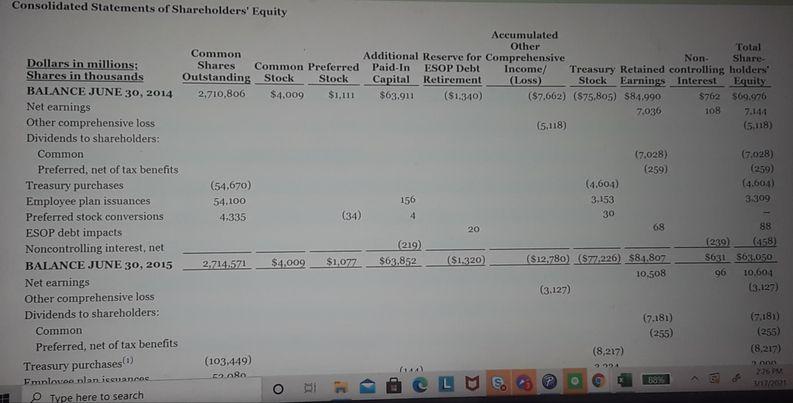
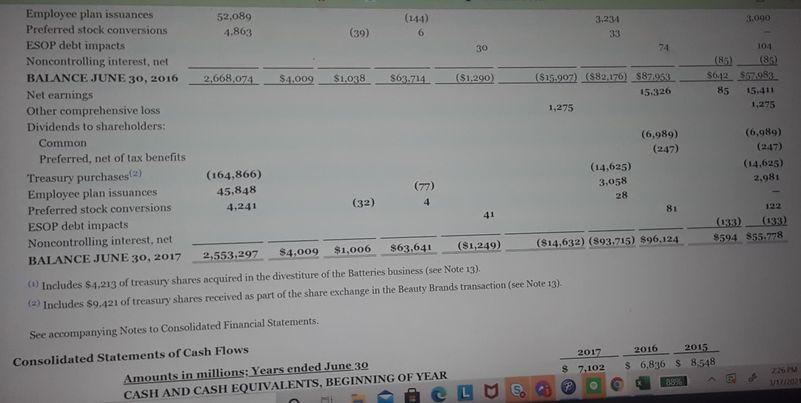
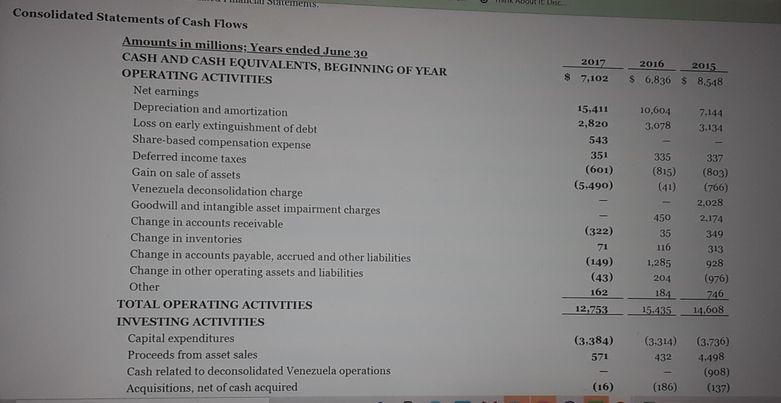
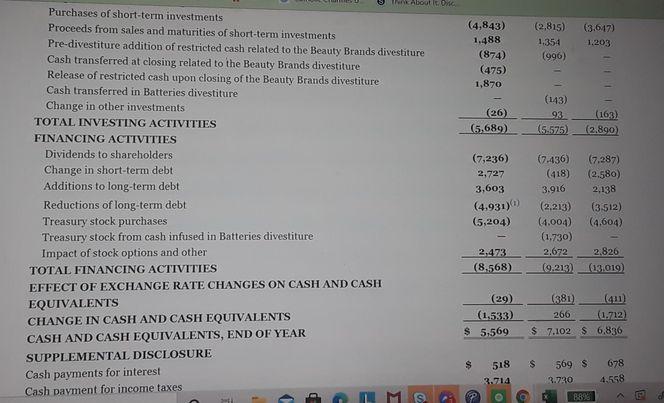
2016 2017 $ 65,058 32,535 18,568 $ 65.299 32.909 18,949 Amounts in millions except per share amounts; Year's ended June 30 NET SALES Cost of products sold Selling, general and administrative expense Venezuela deconsolidation charge OPERATING INCOME Interest expense Interest income Other non-operating income/(expense), net EARNINGS FROM CONTINUING OPERATIONS BEFORE INCOME TAXES Income taxes on continuing operations NET EARNINGS FROM CONTINUING OPERATIONS NET EARNINGS/(LOSS) FROM DISCONTINUED OPERATIONS NET EARNINGS Less: Net earnings attributable to noncontrolling interests NET EARNINGS ATTRIBUTABLE TO PROCTER & GAMBLE BASIC NET EARNINGS PER COMMON SHARE:0) Earnings from continuing operations Earnings/(loss) from discontinued operations BASIC NET EARNINGS PER COMMON SHARE DILUTED NET EARNINGS PER COMMON SHARE:) Earnings from continuing operations Earnings/(loss) from discontinued operations 13.955 465 171 (404) 13,257 3,063 10,194 5,217 15.411 85 S 15 326 13.441 579 182 325 13.369 3.342 10.027 572 10.604 96 $10.508 2015 $ 70.749 37.050 20,616 2,028 11.049 626 149 440 11.012 2.725 8.287 01.143) 24144 108 $7.036 $ S $ 3.79 2.01 5.80 3.59 0.21 3.80 2.92 (0.42) 2.50 $ S S $ $ $ 2.84 3.69 1.90 3-49 0.20 (0.40) MS. BE * 1899 225 PM 3/172021 1.90 OPO Earnings/(loss) from discontinued operations DILUTED NET EARNINGS PER COMMON SHARE DIVIDENDS PER COMMON SHARE $ (040) 2.44 5.59 $ S 3.69 2.66 8 2.70 $ $ Basic net earnings per common share and Diluted net earnings per common share are calculated on Net earnings attributable to Procter & Gamble. 2016 2017 $ 15,411 2015 $ 7.LA $ 10,604 Consolidated Statements of Comprehensive Income Amounts in millions; Year's ended June 30 NET EARNINGS OTHER COMPREHENSIVE INCOME/(LOSS), NET OF TAX Financial statement translation Unrealized gains/(losses) on hedges (net of $(186), $5 and $739 tax, respectively) Unrealized gains/Closses) on investment securities (net of S(6), $7 and so tax, respectively) Unrealized gains/losses) on defined benefit retirement plans (net of $551, $(621) and $328 tax, respectively) TOTAL OTHER COMPREHENSIVE INCOME/(LOSS), NET OF TAX TOTAL COMPREHENSIVE INCOME Less: Total comprehensive income attributable to noncontrolling interests TOTAL COMPREHENSIVE INCOME ATTRIBUTABLE TO PROCTER & GAMBLE 239 (306) (59) 1,401 1,275 16,686 85 $ 16,601 (1.679) 1 28 (1.477) (3.127) 7.4772 96 $ 7381 (7.220) 1.234 24 844 (5.118) 2,026 108 $ 1,918 2017 2016 sho Consolidated Balance Sheets Amounts in millions; As of June 30 Assets CURRENT ASSETS Cash and cash ennivalents nourch 10 22SPM 201 88% O S. CLM o 2017 2016 $ 7,102 5.569 9.568 4973 1.188 503 Consolidated Balance Sheets Amounts in millions; As of June 30 Assets CURRENT ASSETS Cash and cash equivalents Available for sale investment securities Accounts receivable INVENTORIES Materials and supplies Work in process Finished goods Total inventoreis Deferred income taxes Prepaid expenses and other current assets Current assets held for sale TOTAL CURRENT ASSETS PROPERTY, PLANT AND EQUIPMENT, NET GOODWILL TRADEMARKS AND OTHER INTANGIBLE ASSETS.NET OTHER NONCURRENT ASSETS TOTAL ASSETS 1.308 529 2,787 4.624 1.716 1507 2.139 7.185 3182 19:35 44.350 26.494 19,893 44.699 24.187 5,133 $ 120,406 5.092 $ 127,130 226 PM ED Liabilities and Shareholders' Equity CURRENT LIABILITIES Tyne here to search O S 9.632 7,024 13.554 30,210 18.038 8,126 8,254 64.628 9.325 7.449 2.343 11.053 30.270 18.945 9,113 10.325 69.153 Liabilities and Shareholders' Equity CURRENT LIABILITIES Accounts payable Accrued and other liabilities Current liabilities held for sale Debt due within one year TOTAL CURRENT LIABILITIES LONG-TERM DEBT DEFERRED INCOME TAXES OTHER NONCURRENT LIABILITIES TOTAL LIABILITIES SHAREHOLDERS' EQUITY Convertible Class A preferred stock, stated value $1 per share (600 shares authorized) Non-Voting Class B preferred stock, stated value $1 per share (200 shares authorized) Common stock, stated value $i per share (10,000 shares authorized:shares issued: 2017 - 4.009.2, 2016 - 4,009.-) Additional paid-in capital Reserve for ESOP debt retirement Accumulated other comprehensive income/loss) Treasury stock, at cost (shares held: 2017 - 1.455.9.2016 - 1.341.2) Retained earnings Noncontrolling interest TOTAL SHAREHOLDERS' EQUITY TOTAL LIABILITIES AND SHAREHOLDERS' EQUITY See accompanying Notes to Consolidated Financial Statements HI 1,006 1,038 4.009 63.641 (1,249) (14.632) 93.715) 96.124 594 55.778 $ 120.406 4.009 63-714 (1.290) (15.907) (82,176) 87.953 612 57,983 $ 127,136 882 226 PM 31/2021 O Consolidated Statements of Shareholders' Equity Accumulated Common Other Total Additional Reserve for Comprehensive Dollars in millions: Non- Shares Common Preferred Paid-In Share Shares in thousands ESOP Debt Income/ Outstanding Stock Treasury Retained controlling holders Stock Capital Retirement (Loss) BALANCE JUNE 30, 2014 Stock Earnings Interest Equity 2,710,806 $4.009 $1,111 $63.911 Net earnings ($1.310) ($7.662) (S75,805) $84.990 $762 $69,976 7.036 108 7,144 Other comprehensive loss (5.118) Dividends to shareholders: (5,118) Common (7.028) (7.028) Preferred, net of tax benefits (259) Treasury purchases (54,670) (4.604) (4.604 Employee plan issuances 54.100 156 3,153 3309 Preferred stock conversions 4.335 (34) 4 ESOP debt impacts 68 88 Noncontrolling interest, net (219) (239) (458) BALANCE JUNE 30, 2015 2.714.571 $4,009 $1077 $63.852 ($1.320) ($12.780) 57,226) $84.807 $631 S63,050 10.508 96 10.604 Net earnings Other comprehensive loss (3.127) 13.127 Dividends to shareholders: (7.181) 07.181) Common (255) (255) Preferred, net of tax benefits (8,217) (8.217) Treasury purchases) (103.449) Emplexe plan ieuance COLOR EROT Type here to search 20 O 3.090 104 (86) (86) $6,2 567.983 85 15,411 1,275 Employee plan issuances 52,089 Preferred stock conversions (144) 3.234 4,863 (39) 6 ESOP debt impacts 33 30 Noncontrolling interest, net 74 BALANCE JUNE 30, 2016 2.668,074 $4.009 $1,038 $63.7.14 $1.290) ($15.907) (882.176) $87.963 Net earnings 15.326 Other comprehensive loss 1,275 Dividends to shareholders: Common (6,989) Preferred, net of tax benefits (247) Treasury purchases(2) (164,866) (14.625) Employee plan issuances 45,848 (77) 3,058 28 Preferred stock conversions (32) 4.241 41 81 ESOP debt impacts Noncontrolling interest, net $1,006 $4,009 2,553,297 $63.641 ($1,249) BALANCE JUNE 30, 2017 (814,632) (893.715) $96.124 (1) Includes $4,213 of treasury shares acquired in the divestiture of the Batteries business (see Note 13). (2) Includes $9.421 of treasury shares received as part of the share exchange in the Beauty Brands transaction (see Note 13) (6,989) (247) (14.625) 2,981 $594 $55.78 See accompanying Notes to Consolidated Financial Statements. Consolidated Statements of Cash Flows 2017 $ 7,102 2016 2015 $ 6,836 $ 8,548 Amounts in millions: Years ended June 30 CASH AND CASH EQUIVALENTS, BEGINNING OF YEAR 2017 $ 7,102 2016 2015 $ 6,836 $ 8.518 10,604 3.078 7.144 3.134 15,411 2,820 543 351 (601) (5.490) 335 (815) (41) Siemens Consolidated Statements of Cash Flows Amounts in millions: Years ended June 30 CASH AND CASH EQUIVALENTS, BEGINNING OF YEAR OPERATING ACTIVITIES Net earnings Depreciation and amortization Loss on early extinguishment of debt Share-based compensation expense Deferred income taxes Gain on sale of assets Venezuela deconsolidation charge Goodwill and intangible asset impairment charges Change in accounts receivable Change in inventories Change in accounts payable, accrued and other liabilities Change in other operating assets and liabilities Other TOTAL OPERATING ACTIVITIES INVESTING ACTIVITIES Capital expenditures Proceeds from asset sales Cash related to deconsolidated Venezuela operations Acquisitions, net of cash acquired 450 35 116 (322) 71 (149) (43) 162 12.753 337 (803) (766) 2.028 2.174 349 313 928 (976) 1746 14,608 1.285 204 184 15.435 (3.314) (3,384) 571 432 (3.736) 4.498 (908) (137) (16) (186) (4.843) 1.488 (874) (475) 1,870 (2,815) 1.354 (996) (3.647) 1.203 (26) (5.689) (143) 93 15-575) (163) (2.890 Aboutin Purchases of short-term investments Proceeds from sales and maturities of short-term investments Pre-divestiture addition of restricted cash related to the Beauty Brands divestiture Cash transferred at closing related to the Beauty Brands divestiture Release of restricted cash upon closing of the Beauty Brands divestiture Cash transferred in Batteries divestiture Change in other investments TOTAL INVESTING ACTIVITIES FINANCING ACTIVITIES Dividends to shareholders Change in short-term debt Additions to long-term debt Reductions of long-term debt Treasury stock purchases Treasury stock from cash infused in Batteries divestiture Impact of stock options and other TOTAL FINANCING ACTIVITIES EFFECT OF EXCHANGE RATE CHANGES ON CASH AND CASH EQUIVALENTS CHANGE IN CASH AND CASH EQUIVALENTS CASH AND CASH EQUIVALENTS, END OF YEAR SUPPLEMENTAL DISCLOSURE Cash payments for interest Cash payment for income taxes (7,236) 2,727 3,603 (4.931) (5,204) (7.436) (418) 3.916 (2.213) (4.004) (1.730) 2,672 19.213) 6.287) (2.580) 2,138 (3.512) (4.604) 2.473 (8.568) 2.826 13.019. (29) (1.533) $ 5,569 1381 (11) 266 (1.712 $ 7,102 S. 6,836 $ $ 518 3.714 569 $ 3.720 678 4.558 s 8893 - VAT LLLS Dividends to shareholders Change in short-term debt (7.236) (7.436) (7,287) 2.727 (418) (2,580) Additions to long-term debt 3,603 3.916 2,138 Reductions of long-term debt (4.931) (2,213) (3.512) Treasury stock purchases (5,204) (4,004) (4.604) Treasury stock from cash infused in Batteries divestiture (1.730) Impact of stock options and other 2,473 2,672 2,826 TOTAL FINANCING ACTIVITIES (8,568) (9,213) (13.019) EFFECT OF EXCHANGE RATE CHANGES ON CASH AND CASH EQUIVALENTS (29) (381) CHANGE IN CASH AND CASH EQUIVALENTS (1.533) 266 (1.712) CASH AND CASH EQUIVALENTS, END OF YEAR $ 5,569 $ 7.102 $ 6,836 SUPPLEMENTAL DISCLOSURE Cash payments for interest $ 518 569 $ 678 Cash payment for income taxes 3,714 3.730 Divestiture of Batteries business in exchange for shares of P&G stock) 4.213 Divestiture of Beauty business in exchange for shares of P&G stock and assumption of debt 11,360 Assets acquired through non-cash capital leases are immaterial for all periods. Includes $543 of costs related to early extinguishment of debt. (2) Includes $1.730 from cash infused into the Batteries business pursuant to the divestiture agreement (see Note 13). $ 4.558 See accompanying Notes to Consolidated Financial Statements. 2016 2017 $ 65,058 32,535 18,568 $ 65.299 32.909 18,949 Amounts in millions except per share amounts; Year's ended June 30 NET SALES Cost of products sold Selling, general and administrative expense Venezuela deconsolidation charge OPERATING INCOME Interest expense Interest income Other non-operating income/(expense), net EARNINGS FROM CONTINUING OPERATIONS BEFORE INCOME TAXES Income taxes on continuing operations NET EARNINGS FROM CONTINUING OPERATIONS NET EARNINGS/(LOSS) FROM DISCONTINUED OPERATIONS NET EARNINGS Less: Net earnings attributable to noncontrolling interests NET EARNINGS ATTRIBUTABLE TO PROCTER & GAMBLE BASIC NET EARNINGS PER COMMON SHARE:0) Earnings from continuing operations Earnings/(loss) from discontinued operations BASIC NET EARNINGS PER COMMON SHARE DILUTED NET EARNINGS PER COMMON SHARE:) Earnings from continuing operations Earnings/(loss) from discontinued operations 13.955 465 171 (404) 13,257 3,063 10,194 5,217 15.411 85 S 15 326 13.441 579 182 325 13.369 3.342 10.027 572 10.604 96 $10.508 2015 $ 70.749 37.050 20,616 2,028 11.049 626 149 440 11.012 2.725 8.287 01.143) 24144 108 $7.036 $ S $ 3.79 2.01 5.80 3.59 0.21 3.80 2.92 (0.42) 2.50 $ S S $ $ $ 2.84 3.69 1.90 3-49 0.20 (0.40) MS. BE * 1899 225 PM 3/172021 1.90 OPO Earnings/(loss) from discontinued operations DILUTED NET EARNINGS PER COMMON SHARE DIVIDENDS PER COMMON SHARE $ (040) 2.44 5.59 $ S 3.69 2.66 8 2.70 $ $ Basic net earnings per common share and Diluted net earnings per common share are calculated on Net earnings attributable to Procter & Gamble. 2016 2017 $ 15,411 2015 $ 7.LA $ 10,604 Consolidated Statements of Comprehensive Income Amounts in millions; Year's ended June 30 NET EARNINGS OTHER COMPREHENSIVE INCOME/(LOSS), NET OF TAX Financial statement translation Unrealized gains/(losses) on hedges (net of $(186), $5 and $739 tax, respectively) Unrealized gains/Closses) on investment securities (net of S(6), $7 and so tax, respectively) Unrealized gains/losses) on defined benefit retirement plans (net of $551, $(621) and $328 tax, respectively) TOTAL OTHER COMPREHENSIVE INCOME/(LOSS), NET OF TAX TOTAL COMPREHENSIVE INCOME Less: Total comprehensive income attributable to noncontrolling interests TOTAL COMPREHENSIVE INCOME ATTRIBUTABLE TO PROCTER & GAMBLE 239 (306) (59) 1,401 1,275 16,686 85 $ 16,601 (1.679) 1 28 (1.477) (3.127) 7.4772 96 $ 7381 (7.220) 1.234 24 844 (5.118) 2,026 108 $ 1,918 2017 2016 sho Consolidated Balance Sheets Amounts in millions; As of June 30 Assets CURRENT ASSETS Cash and cash ennivalents nourch 10 22SPM 201 88% O S. CLM o 2017 2016 $ 7,102 5.569 9.568 4973 1.188 503 Consolidated Balance Sheets Amounts in millions; As of June 30 Assets CURRENT ASSETS Cash and cash equivalents Available for sale investment securities Accounts receivable INVENTORIES Materials and supplies Work in process Finished goods Total inventoreis Deferred income taxes Prepaid expenses and other current assets Current assets held for sale TOTAL CURRENT ASSETS PROPERTY, PLANT AND EQUIPMENT, NET GOODWILL TRADEMARKS AND OTHER INTANGIBLE ASSETS.NET OTHER NONCURRENT ASSETS TOTAL ASSETS 1.308 529 2,787 4.624 1.716 1507 2.139 7.185 3182 19:35 44.350 26.494 19,893 44.699 24.187 5,133 $ 120,406 5.092 $ 127,130 226 PM ED Liabilities and Shareholders' Equity CURRENT LIABILITIES Tyne here to search O S 9.632 7,024 13.554 30,210 18.038 8,126 8,254 64.628 9.325 7.449 2.343 11.053 30.270 18.945 9,113 10.325 69.153 Liabilities and Shareholders' Equity CURRENT LIABILITIES Accounts payable Accrued and other liabilities Current liabilities held for sale Debt due within one year TOTAL CURRENT LIABILITIES LONG-TERM DEBT DEFERRED INCOME TAXES OTHER NONCURRENT LIABILITIES TOTAL LIABILITIES SHAREHOLDERS' EQUITY Convertible Class A preferred stock, stated value $1 per share (600 shares authorized) Non-Voting Class B preferred stock, stated value $1 per share (200 shares authorized) Common stock, stated value $i per share (10,000 shares authorized:shares issued: 2017 - 4.009.2, 2016 - 4,009.-) Additional paid-in capital Reserve for ESOP debt retirement Accumulated other comprehensive income/loss) Treasury stock, at cost (shares held: 2017 - 1.455.9.2016 - 1.341.2) Retained earnings Noncontrolling interest TOTAL SHAREHOLDERS' EQUITY TOTAL LIABILITIES AND SHAREHOLDERS' EQUITY See accompanying Notes to Consolidated Financial Statements HI 1,006 1,038 4.009 63.641 (1,249) (14.632) 93.715) 96.124 594 55.778 $ 120.406 4.009 63-714 (1.290) (15.907) (82,176) 87.953 612 57,983 $ 127,136 882 226 PM 31/2021 O Consolidated Statements of Shareholders' Equity Accumulated Common Other Total Additional Reserve for Comprehensive Dollars in millions: Non- Shares Common Preferred Paid-In Share Shares in thousands ESOP Debt Income/ Outstanding Stock Treasury Retained controlling holders Stock Capital Retirement (Loss) BALANCE JUNE 30, 2014 Stock Earnings Interest Equity 2,710,806 $4.009 $1,111 $63.911 Net earnings ($1.310) ($7.662) (S75,805) $84.990 $762 $69,976 7.036 108 7,144 Other comprehensive loss (5.118) Dividends to shareholders: (5,118) Common (7.028) (7.028) Preferred, net of tax benefits (259) Treasury purchases (54,670) (4.604) (4.604 Employee plan issuances 54.100 156 3,153 3309 Preferred stock conversions 4.335 (34) 4 ESOP debt impacts 68 88 Noncontrolling interest, net (219) (239) (458) BALANCE JUNE 30, 2015 2.714.571 $4,009 $1077 $63.852 ($1.320) ($12.780) 57,226) $84.807 $631 S63,050 10.508 96 10.604 Net earnings Other comprehensive loss (3.127) 13.127 Dividends to shareholders: (7.181) 07.181) Common (255) (255) Preferred, net of tax benefits (8,217) (8.217) Treasury purchases) (103.449) Emplexe plan ieuance COLOR EROT Type here to search 20 O 3.090 104 (86) (86) $6,2 567.983 85 15,411 1,275 Employee plan issuances 52,089 Preferred stock conversions (144) 3.234 4,863 (39) 6 ESOP debt impacts 33 30 Noncontrolling interest, net 74 BALANCE JUNE 30, 2016 2.668,074 $4.009 $1,038 $63.7.14 $1.290) ($15.907) (882.176) $87.963 Net earnings 15.326 Other comprehensive loss 1,275 Dividends to shareholders: Common (6,989) Preferred, net of tax benefits (247) Treasury purchases(2) (164,866) (14.625) Employee plan issuances 45,848 (77) 3,058 28 Preferred stock conversions (32) 4.241 41 81 ESOP debt impacts Noncontrolling interest, net $1,006 $4,009 2,553,297 $63.641 ($1,249) BALANCE JUNE 30, 2017 (814,632) (893.715) $96.124 (1) Includes $4,213 of treasury shares acquired in the divestiture of the Batteries business (see Note 13). (2) Includes $9.421 of treasury shares received as part of the share exchange in the Beauty Brands transaction (see Note 13) (6,989) (247) (14.625) 2,981 $594 $55.78 See accompanying Notes to Consolidated Financial Statements. Consolidated Statements of Cash Flows 2017 $ 7,102 2016 2015 $ 6,836 $ 8,548 Amounts in millions: Years ended June 30 CASH AND CASH EQUIVALENTS, BEGINNING OF YEAR 2017 $ 7,102 2016 2015 $ 6,836 $ 8.518 10,604 3.078 7.144 3.134 15,411 2,820 543 351 (601) (5.490) 335 (815) (41) Siemens Consolidated Statements of Cash Flows Amounts in millions: Years ended June 30 CASH AND CASH EQUIVALENTS, BEGINNING OF YEAR OPERATING ACTIVITIES Net earnings Depreciation and amortization Loss on early extinguishment of debt Share-based compensation expense Deferred income taxes Gain on sale of assets Venezuela deconsolidation charge Goodwill and intangible asset impairment charges Change in accounts receivable Change in inventories Change in accounts payable, accrued and other liabilities Change in other operating assets and liabilities Other TOTAL OPERATING ACTIVITIES INVESTING ACTIVITIES Capital expenditures Proceeds from asset sales Cash related to deconsolidated Venezuela operations Acquisitions, net of cash acquired 450 35 116 (322) 71 (149) (43) 162 12.753 337 (803) (766) 2.028 2.174 349 313 928 (976) 1746 14,608 1.285 204 184 15.435 (3.314) (3,384) 571 432 (3.736) 4.498 (908) (137) (16) (186) (4.843) 1.488 (874) (475) 1,870 (2,815) 1.354 (996) (3.647) 1.203 (26) (5.689) (143) 93 15-575) (163) (2.890 Aboutin Purchases of short-term investments Proceeds from sales and maturities of short-term investments Pre-divestiture addition of restricted cash related to the Beauty Brands divestiture Cash transferred at closing related to the Beauty Brands divestiture Release of restricted cash upon closing of the Beauty Brands divestiture Cash transferred in Batteries divestiture Change in other investments TOTAL INVESTING ACTIVITIES FINANCING ACTIVITIES Dividends to shareholders Change in short-term debt Additions to long-term debt Reductions of long-term debt Treasury stock purchases Treasury stock from cash infused in Batteries divestiture Impact of stock options and other TOTAL FINANCING ACTIVITIES EFFECT OF EXCHANGE RATE CHANGES ON CASH AND CASH EQUIVALENTS CHANGE IN CASH AND CASH EQUIVALENTS CASH AND CASH EQUIVALENTS, END OF YEAR SUPPLEMENTAL DISCLOSURE Cash payments for interest Cash payment for income taxes (7,236) 2,727 3,603 (4.931) (5,204) (7.436) (418) 3.916 (2.213) (4.004) (1.730) 2,672 19.213) 6.287) (2.580) 2,138 (3.512) (4.604) 2.473 (8.568) 2.826 13.019. (29) (1.533) $ 5,569 1381 (11) 266 (1.712 $ 7,102 S. 6,836 $ $ 518 3.714 569 $ 3.720 678 4.558 s 8893 - VAT LLLS Dividends to shareholders Change in short-term debt (7.236) (7.436) (7,287) 2.727 (418) (2,580) Additions to long-term debt 3,603 3.916 2,138 Reductions of long-term debt (4.931) (2,213) (3.512) Treasury stock purchases (5,204) (4,004) (4.604) Treasury stock from cash infused in Batteries divestiture (1.730) Impact of stock options and other 2,473 2,672 2,826 TOTAL FINANCING ACTIVITIES (8,568) (9,213) (13.019) EFFECT OF EXCHANGE RATE CHANGES ON CASH AND CASH EQUIVALENTS (29) (381) CHANGE IN CASH AND CASH EQUIVALENTS (1.533) 266 (1.712) CASH AND CASH EQUIVALENTS, END OF YEAR $ 5,569 $ 7.102 $ 6,836 SUPPLEMENTAL DISCLOSURE Cash payments for interest $ 518 569 $ 678 Cash payment for income taxes 3,714 3.730 Divestiture of Batteries business in exchange for shares of P&G stock) 4.213 Divestiture of Beauty business in exchange for shares of P&G stock and assumption of debt 11,360 Assets acquired through non-cash capital leases are immaterial for all periods. Includes $543 of costs related to early extinguishment of debt. (2) Includes $1.730 from cash infused into the Batteries business pursuant to the divestiture agreement (see Note 13). $ 4.558 See accompanying Notes to Consolidated Financial Statements