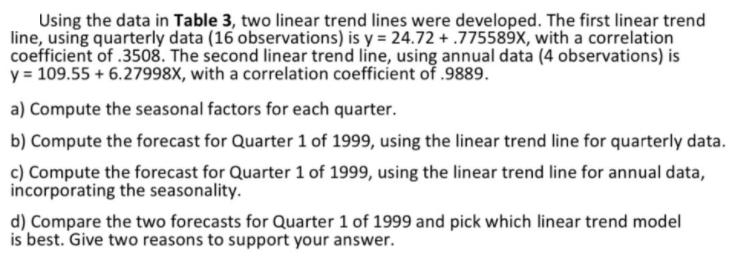
Question: Using the data in Table 3, two linear trend lines were developed. The first linear trend line, using quarterly data (16 observations) is y


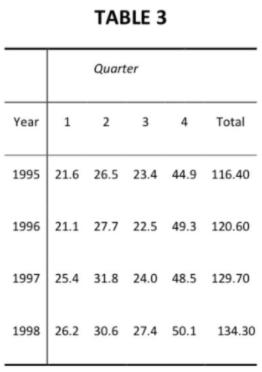
Using the data in Table 3, two linear trend lines were developed. The first linear trend line, using quarterly data (16 observations) is y = 24.72 +.775589X, with a correlation coefficient of .3508. The second linear trend line, using annual data (4 observations) is y = 109.55 + 6.27998X, with a correlation coefficient of .9889. a) Compute the seasonal factors for each quarter. b) Compute the forecast for Quarter 1 of 1999, using the linear trend line for quarterly data. c) Compute the forecast for Quarter 1 of 1999, using the linear trend line for annual data, incorporating the seasonality. d) Compare the two forecasts for Quarter 1 of 1999 and pick which linear trend model is best. Give two reasons to support your answer. TABLE 3 Quarter Year 1 2 3 4 Total 1995 21.6 26.5 23.4 44.9 116.40 1996 21.1 27.7 22.5 49.3 120.60 1997 25.4 31.8 24.0 48.5 129.70 1998 26.2 30.6 27.4 50.1 134.30
Step by Step Solution
3.46 Rating (169 Votes )
There are 3 Steps involved in it

Get step-by-step solutions from verified subject matter experts


