the first photo is the information of the last question(2a,2b), need detailed steps for all of the questions asap thank you. 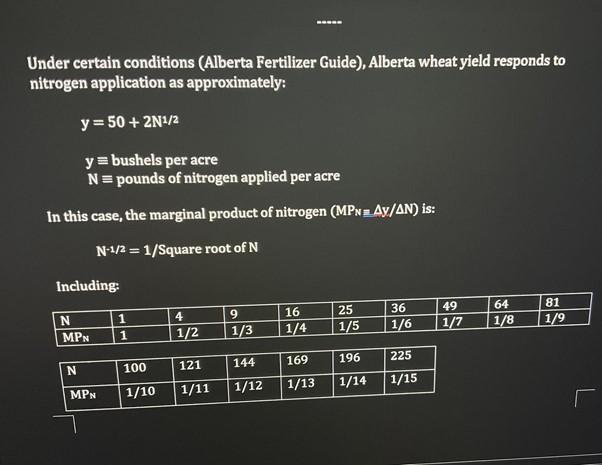
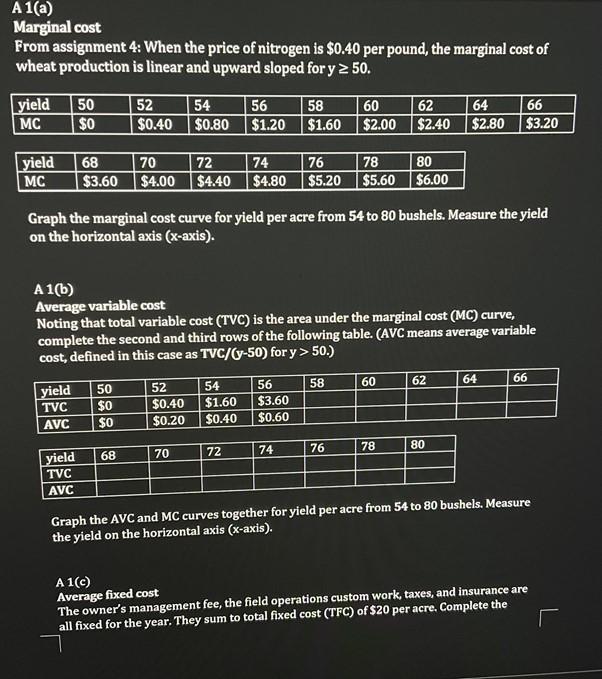
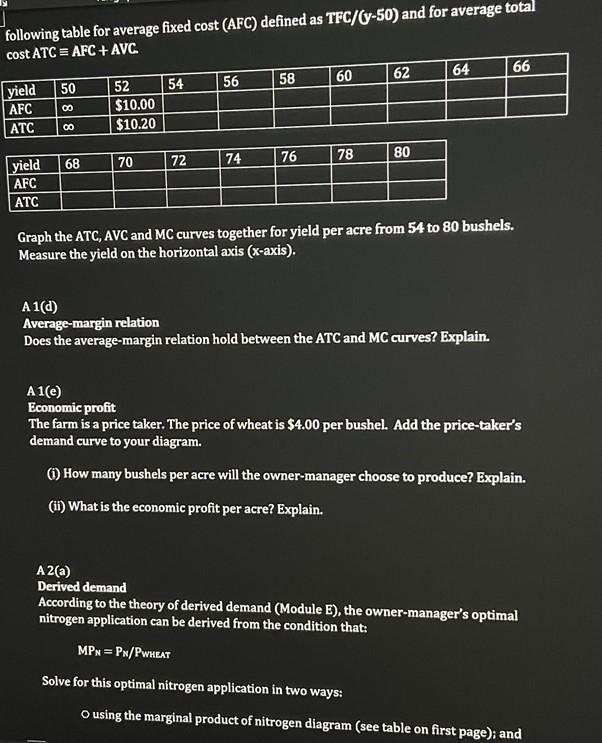
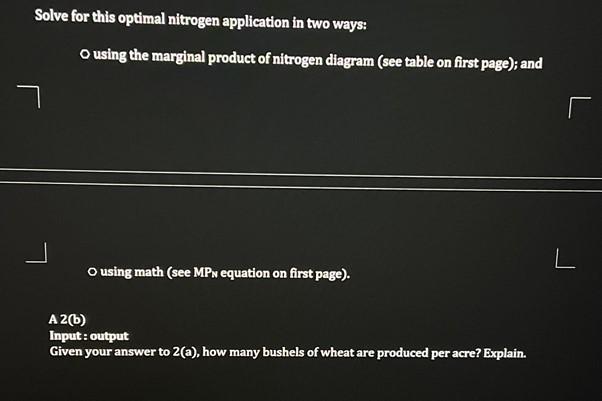
Under certain conditions (Alberta Fertilizer Guide), Alberta wheat yield responds to nitrogen application as approximately: y = 50 + 2N2/2 y = bushels per acre N = pounds of nitrogen applied per acre In this case, the marginal product of nitrogen (MPN. Ay/AN) is: N-1/2 = 1/Square root of N Including: 81 N MPN 1 1 4 1/2 9 1/3 16 1/4 25 1/5 36 1/6 1/9 49 1/7 64 1/8 169 196 225 121 144 100 N 1/13 1/14 1/15 MPN 1/10 1/11 1/12 A 1(a) Marginal cost From assignment 4: When the price of nitrogen is $0.40 per pound, the marginal cost of wheat production is linear and upward sloped for y = 50. 50 52 yield MC 54 $0.80 56 $1.20 58 $1.60 60 $2.00 62 $2.40 64 $2.80 66 $3.20 $0 $0.40 yield MC 68 $3.60 70 $4.00 72 $4.40 74 $4.80 76 $5.20 78 $5.60 80 $6.00 Graph the marginal cost curve for yield per acre from 54 to 80 bushels. Measure the yield on the horizontal axis (x-axis). A 1(b) Average variable cost Noting that total variable cost (TVC) is the area under the marginal cost (MC) curve, complete the second and third rows of the following table. (AVC means average variable cost, defined in this case as TVC/(y-50) for y> 50.) 60 58 62 64 66 54 yield TVC AVC 50 $0 $0 52 $0.40 $0.20 $1.60 $0.40 56 $3.60 $0.60 78 80 70 76 68 72 74 yield TVC AVC Graph the AVC and MC curves together for yield per acre from 54 to 80 bushels. Measure the yield on the horizontal axis (x-axis). A1(c) Average fixed cost The owner's management fee, the field operations custom work, taxes, and insurance are all fixed for the year. They sum to total fixed cost (TFC) of $20 per acre. Complete the following table for average fixed cost (AFC) defined as TFC/Cy-50) and for average total cost ATC = AFC + AVC 62 64 66 60 58 54 56 yield 50 00 AFC ATC 52 $10.00 $10.20 00 74 76 78 80 68 70 72 yield AFC ATC Graph the ATC, AVC and MC curves together for yield per acre from 54 to 80 bushels. Measure the yield on the horizontal axis (x-axis). A1(d) Average-margin relation Does the average-margin relation hold between the ATC and MC curves? Explain. A1(e) Economic profit The farm is a price taker. The price of wheat is $4.00 per bushel. Add the price-taker's demand curve to your diagram. How many bushels per acre will the owner-manager choose to produce? Explain. (11) What is the economic profit per acre? Explain. A 2(a) Derived demand According to the theory of derived demand (Module E), the owner-manager's optimal nitrogen application can be derived from the condition that: MPN = Px/PWHEAT Solve for this optimal nitrogen application in two ways: O using the marginal product of nitrogen diagram (see table on first page); and Solve for this optimal nitrogen application in two ways: O using the marginal product of nitrogen diagram (see table on first page); and L O using math (see MPs equation on first page). A 2(6) Input: output Given your answer to 2(a), how many bushels of wheat are produced per acre? Explain. Under certain conditions (Alberta Fertilizer Guide), Alberta wheat yield responds to nitrogen application as approximately: y = 50 + 2N2/2 y = bushels per acre N = pounds of nitrogen applied per acre In this case, the marginal product of nitrogen (MPN. Ay/AN) is: N-1/2 = 1/Square root of N Including: 81 N MPN 1 1 4 1/2 9 1/3 16 1/4 25 1/5 36 1/6 1/9 49 1/7 64 1/8 169 196 225 121 144 100 N 1/13 1/14 1/15 MPN 1/10 1/11 1/12 A 1(a) Marginal cost From assignment 4: When the price of nitrogen is $0.40 per pound, the marginal cost of wheat production is linear and upward sloped for y = 50. 50 52 yield MC 54 $0.80 56 $1.20 58 $1.60 60 $2.00 62 $2.40 64 $2.80 66 $3.20 $0 $0.40 yield MC 68 $3.60 70 $4.00 72 $4.40 74 $4.80 76 $5.20 78 $5.60 80 $6.00 Graph the marginal cost curve for yield per acre from 54 to 80 bushels. Measure the yield on the horizontal axis (x-axis). A 1(b) Average variable cost Noting that total variable cost (TVC) is the area under the marginal cost (MC) curve, complete the second and third rows of the following table. (AVC means average variable cost, defined in this case as TVC/(y-50) for y> 50.) 60 58 62 64 66 54 yield TVC AVC 50 $0 $0 52 $0.40 $0.20 $1.60 $0.40 56 $3.60 $0.60 78 80 70 76 68 72 74 yield TVC AVC Graph the AVC and MC curves together for yield per acre from 54 to 80 bushels. Measure the yield on the horizontal axis (x-axis). A1(c) Average fixed cost The owner's management fee, the field operations custom work, taxes, and insurance are all fixed for the year. They sum to total fixed cost (TFC) of $20 per acre. Complete the following table for average fixed cost (AFC) defined as TFC/Cy-50) and for average total cost ATC = AFC + AVC 62 64 66 60 58 54 56 yield 50 00 AFC ATC 52 $10.00 $10.20 00 74 76 78 80 68 70 72 yield AFC ATC Graph the ATC, AVC and MC curves together for yield per acre from 54 to 80 bushels. Measure the yield on the horizontal axis (x-axis). A1(d) Average-margin relation Does the average-margin relation hold between the ATC and MC curves? Explain. A1(e) Economic profit The farm is a price taker. The price of wheat is $4.00 per bushel. Add the price-taker's demand curve to your diagram. How many bushels per acre will the owner-manager choose to produce? Explain. (11) What is the economic profit per acre? Explain. A 2(a) Derived demand According to the theory of derived demand (Module E), the owner-manager's optimal nitrogen application can be derived from the condition that: MPN = Px/PWHEAT Solve for this optimal nitrogen application in two ways: O using the marginal product of nitrogen diagram (see table on first page); and Solve for this optimal nitrogen application in two ways: O using the marginal product of nitrogen diagram (see table on first page); and L O using math (see MPs equation on first page). A 2(6) Input: output Given your answer to 2(a), how many bushels of wheat are produced per acre? Explain


