Question
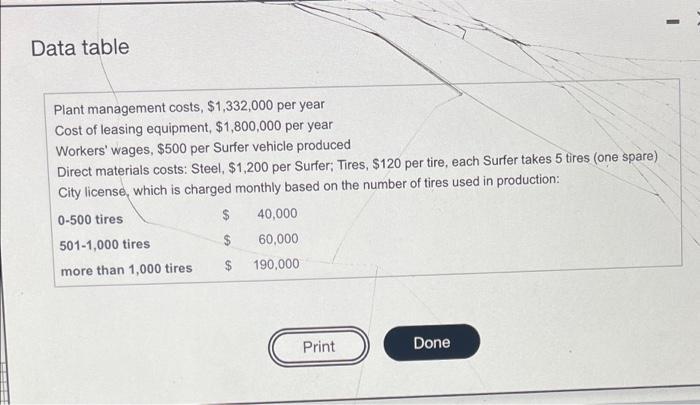
The first picture shows the manufacturing costs in order to plot the graph correctly. It asks to plot a graph for the variable manufacturing costs

Data table Plant management costs, $1,332,000 per year Cost of leasing equipment, $1,800,000 per year Workers' wages, $500 per Surfer vehicle produced Direct materials costs: Steel, $1,200 per Surfer; Tires, $120 per tire, each Surfer takes 5 tires (one spare) City license, which is charged monthly based on the number of tires used in production: 0-500 tires $ 40,000 501-1,000 tires 2$ 60,000 more than 1,000 tires 190,000 Print Done
Step by Step Solution
3.53 Rating (153 Votes )
There are 3 Steps involved in it
Step: 1
Answer The answe...
Get Instant Access to Expert-Tailored Solutions
See step-by-step solutions with expert insights and AI powered tools for academic success
Step: 2

Step: 3

Ace Your Homework with AI
Get the answers you need in no time with our AI-driven, step-by-step assistance
Get StartedRecommended Textbook for
Financial and Managerial Accounting
Authors: Jonathan E. Duchac, James M. Reeve, Carl S. Warren
11th Edition
9780538480901, 9781111525774, 538480890, 538480904, 1111525773, 978-0538480895
Students also viewed these Accounting questions
Question
Answered: 1 week ago
Question
Answered: 1 week ago
Question
Answered: 1 week ago
Question
Answered: 1 week ago
Question
Answered: 1 week ago
Question
Answered: 1 week ago
Question
Answered: 1 week ago
Question
Answered: 1 week ago
Question
Answered: 1 week ago
Question
Answered: 1 week ago
Question
Answered: 1 week ago
Question
Answered: 1 week ago
Question
Answered: 1 week ago
Question
Answered: 1 week ago
Question
Answered: 1 week ago
Question
Answered: 1 week ago
Question
Answered: 1 week ago
Question
Answered: 1 week ago
Question
Answered: 1 week ago
Question
Answered: 1 week ago
Question
Answered: 1 week ago
View Answer in SolutionInn App


