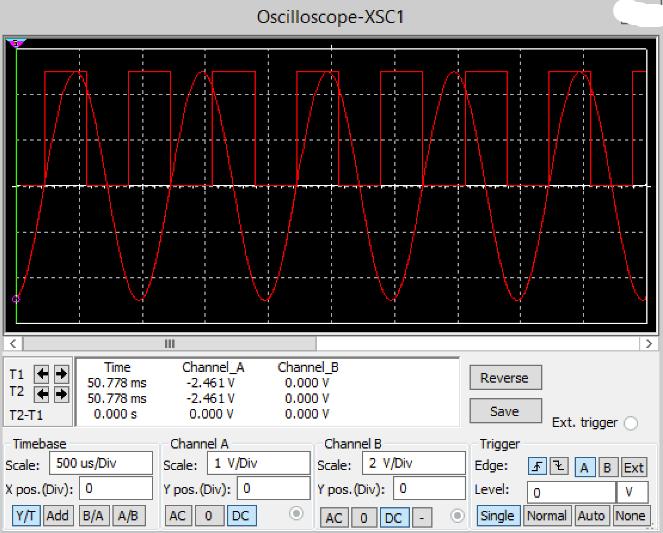
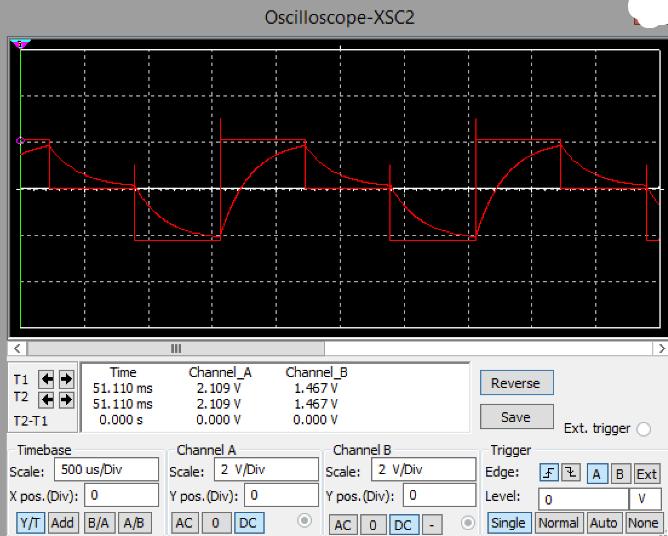
The first screenshot shows the oscilloscope-XSC1 display with the analog input signal and sampling clock at the input to the ADC. The second screenshot shows
The first screenshot shows the oscilloscope-XSC1 display with the analog input signal and sampling clock at the input to the ADC. The second screenshot shows the oscilloscope-XSC2 display with the output of the DAC. how to figure out the effects of increasing or decreasing the sampling rate?


< T1+ T2 T2-T1 Time 50.778 ms 50.778 ms 0.000 s Timebase Scale: 500 us/Div X pos. (Div): 0 Y/T Add B/A A/B Channel A -2.461 V -2.461 V 0.000 V Oscilloscope-XSC1 Channel A Scale: 1 V/Div Y pos. (Div): 0 AC 0 DC H Channel B 0.000 V 0.000 V 0.000 V Channel B Scale: 2 V/Div Y pos. (Div): 0 AC 0 DC > Reverse Save Trigger Edge: FAB Ext Level: 0 V Single Normal Auto None Ext. trigger
Step by Step Solution
There are 3 Steps involved in it
Step: 1
To determine the effects of changing the sampling rate on the performance of an analogtodigital converter ADC and digitaltoanalog converter DAC system ...
See step-by-step solutions with expert insights and AI powered tools for academic success
Step: 2

Step: 3

Ace Your Homework with AI
Get the answers you need in no time with our AI-driven, step-by-step assistance
Get Started


